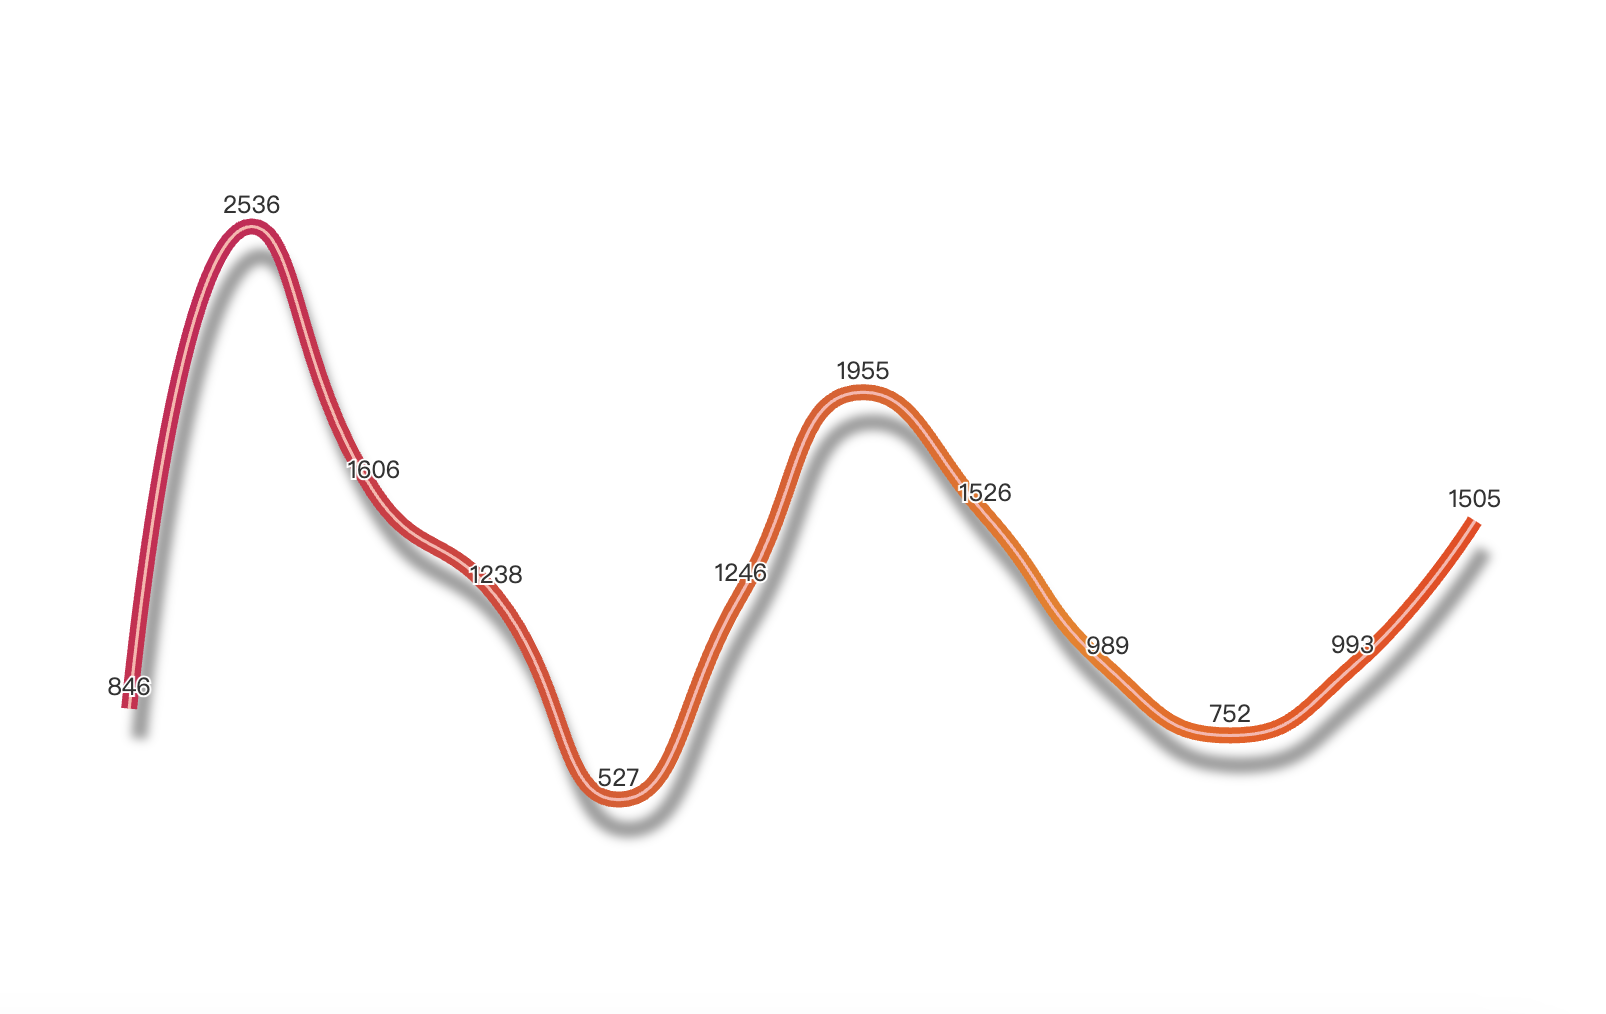
var data = [];
for (let i = 0; i < 12; ++i) {
  data.push(Math.round(Math.random() * 10));
}
option = {
  grid: {
    bottom: 50,
    left: 50,
    top: 80,
    right: 50,
  },
  xAxis: {
    axisLine: {
      show: false,
    },
    axisTick: {
      show: false,
    },
    splitLine: {
      show: false,
    },
    axisLabel: {
      show: false,
    },
    data: ['A', 'B', 'C', 'D', 'E', 'F', 'G', 'H', 'I', 'J', 'K', 'L'],
  },
  yAxis: {
    axisLine: {
      show: false,
    },
    axisTick: {
      show: false,
    },
    splitLine: {
      show: false,
    },
    axisLabel: {
      show: false,
    },
  },
  series: [
    {
      type: 'line',
      smooth: true,
      symbol: 'circle',
      symbolSize: 0,
      z: 2,
      lineStyle: {
        normal: {
          shadowColor: '#fca28a',
          shadowBlur: 0,
          shadowOffsetY: 0.1,
          shadowOffsetX: 0.1,
          width: 1.5,
          color: '#ffb4ad',
        },
      },
      itemStyle: {
        color: '#fff',
        borderColor: '#7c1fa2',
        borderWidth: 1,
      },
      data: data,
      label: {
        show: true,
        position: 'top',
        valueAnimation: true,
      },
      animationDuration: 0,
      animationDurationUpdate: 1000,
      animationEasing: 'linear',
      animationEasingUpdate: 'linear',
    },
    {
      type: 'line',
      smooth: true,
      symbol: 'circle',
      symbolSize: 0,
      z: 0,
      lineStyle: {
        normal: {
          shadowColor: 'rgba(0, 0, 0, .4)',
          shadowBlur: 5,
          shadowOffsetY: 15,
          shadowOffsetX: 5,
          width: 8,
          color: {
            type: 'linear',
            x: 0,
            y: 0,
            x2: 1,
            y2: 1,
            colorStops: [
              {
                offset: 1,
                color: '#f32605',
              },
              {
                offset: 0.7,
                color: '#F37D05',
              },
              {
                offset: 0,
                color: '#CC045F',
              },
            ],
            globalCoord: false,
          },
        },
      },
      itemStyle: {
        color: '#fff',
        borderColor: '#7c1fa2',
        borderWidth: 1,
      },
      data: data,
      animationDuration: 0,
      animationDurationUpdate: 1000,
      animationEasing: 'linear',
      animationEasingUpdate: 'linear',
    },
  ],
};
function run() {
  var data = option.series[0].data;
  for (var i = 0; i < data.length; ++i) {
    if (Math.random() > 0.5) {
      data[i] += Math.round(Math.random() * 1500);
    } else {
      data[i] += Math.round(Math.random() * 500);
    }
  }
  myChart.setOption(option);
}

setTimeout(function () {
  run();
}, 0);
setInterval(function () {
  run();
}, 3000);
点击运行 》

