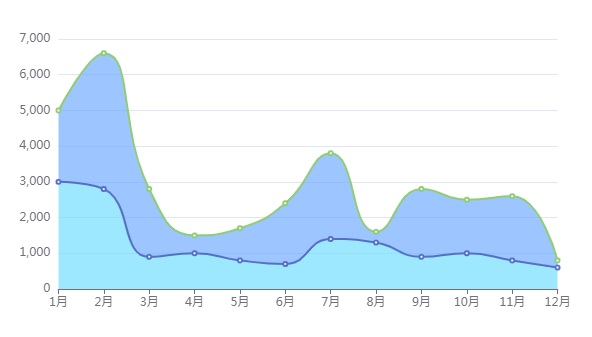
var option = {
  xAxis: {
    type: 'category',
    data: ['1月', '2月', '3月', '4月', '5月', '6月', '7月', '8月', '9月', '10月', '11月', '12月'],
    boundaryGap: false
  },
  yAxis: {
    type: 'value',
    scale: true
  },
  series: [
    {
      name: '2022年',
      type: 'line',
      data: [3000, 2800, 900, 1000, 800, 700, 1400, 1300, 900, 1000, 800, 600],
      smooth: true,
      areaStyle: {
        color: '#73DDFF'
      },
      stack: 'all'
    },
    {
      name: '2023年',
      type: 'line',
      data: [2000, 3800, 1900, 500, 900, 1700, 2400, 300, 1900, 1500, 1800, 200],
      smooth:true,
      areaStyle: {
        color: '#73ACFF'
      },
      stack: 'all'
    }
  ]
}

var myChart = echarts.init(document.getElementById('main'));
myChart.setOption(option);
点击运行 》

