Echarts可视化教程

  1. 网站首页
  2. 百度ECharts
  3. ECharts实例
  4. ECharts入门
  5. 地图大全
  6. ECharts官网

百度Echarts折线图系列之极简风

option = {
    backgroundColor: new echarts.graphic.LinearGradient(0, 0, 0, 1, [{
            offset: 0,
            color: '#c86589'
        },
        {
            offset: 1,
            color: '#06a7ff'
        }
    ], false),
    grid: {
        top: '20%',
        left: '10%',
        right: '10%',
        bottom: '15%',
        containLabel: true,
    },
    xAxis: {
        type: 'category',
        boundaryGap: false,
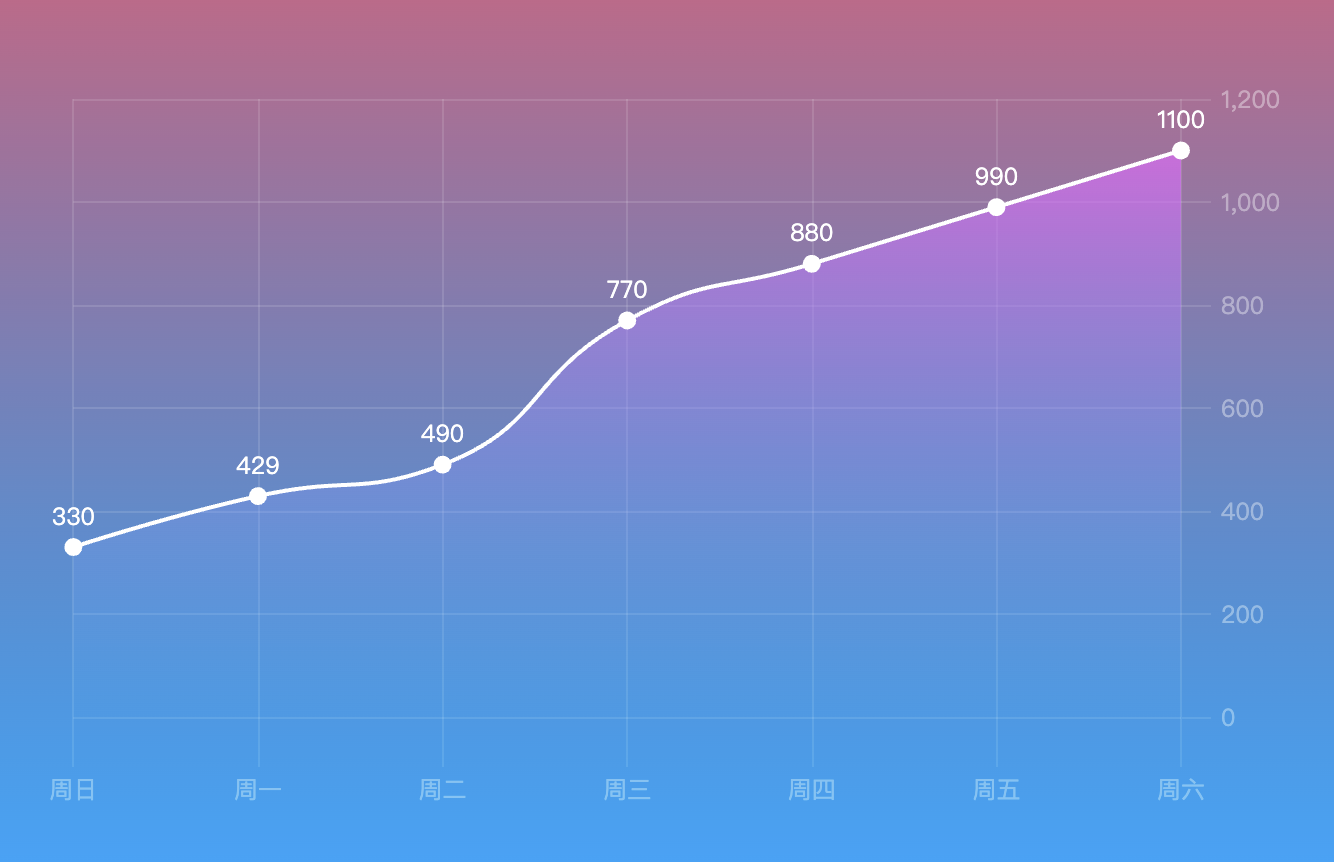
        data: ['周日', '周一', '周二', '周三', '周四', '周五', '周六'],
        axisLabel: {
            margin: 30,
            color: '#ffffff63'
        },
        axisLine: {
            show: false
        },
        axisTick: {
            show: true,
            length: 25,
            lineStyle: {
                color: "#ffffff1f"
            }
        },
        splitLine: {
            show: true,
            lineStyle: {
                color: '#ffffff1f'
            }
        }
    },
    yAxis: [{
        type: 'value',
        position: 'right',
        axisLabel: {
            margin: 20,
            color: '#ffffff63'
        },

        axisTick: {
            show: true,
            length: 15,
            lineStyle: {
                color: "#ffffff1f",
            }
        },
        splitLine: {
            show: true,
            lineStyle: {
                color: '#ffffff1f'
            }
        },
        axisLine: {
            lineStyle: {
                color: '#fff',
                width: 2
            }
        }
    }],
    series: [{
        name: '访问总量',
        type: 'line',
        smooth: true, //是否平滑曲线显示
        showAllSymbol: true,
        symbol: 'circle',
        symbolSize: 6,
        lineStyle: {
            normal: {
                color: "#fff", // 线条颜色
            },
        },
        label: {
            show: true,
            position: 'top',
            textStyle: {
                color: '#fff',
            }
        },
        itemStyle: {
            color: "#fff",
            borderColor: "#fff",
            borderWidth: 3
        },
        tooltip: {
            show: false
        },
        areaStyle: {
            normal: {
                color: new echarts.graphic.LinearGradient(0, 0, 0, 1, [{
                        offset: 0,
                        color: '#eb64fb'
                    },
                    {
                        offset: 1,
                        color: '#3fbbff0d'
                    }
                ], false),
            }
        },
        data: [330, 429, 490, 770, 880, 990, 1100]
    }]
};

点击运行 》

点击展开全文

相关文章

  1. 百度Echarts图表之柱状图+折线图组合系列
  2. 百度Echarts折线图系列之动态效果
  3. 百度Echarts折线图系列之光滑效果
  4. 百度Echarts折线图系列之自定义拐点正方形样式
  5. 百度Echarts折线图系列之自定义拐点样式