var data = [
{
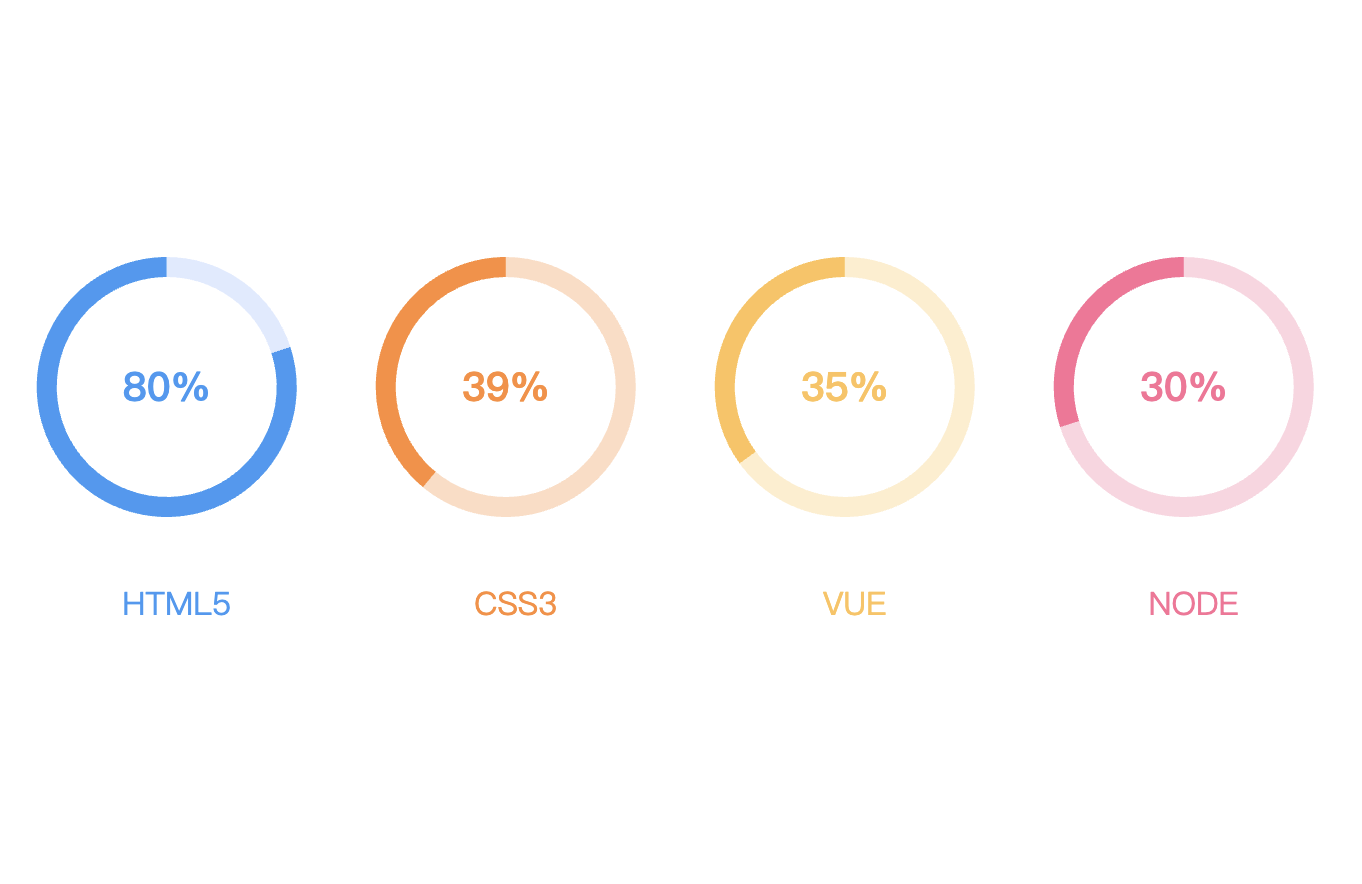
name: 'HTML5',
value: 80
},{
name: 'CSS3',
value: 39
},{
name: 'VUE',
value: 35
},{
name: 'NODE',
value: 30
}]
var titleArr= [], seriesArr=[];
colors=[['#389af4', '#dfeaff'],['#ff8c37', '#ffdcc3'],['#ffc257', '#ffedcc'], ['#fd6f97', '#fed4e0']]
data.forEach(function(item, index){
titleArr.push(
{
text:item.name,
left: index * 25 + 12 +'%',
top: '75%',
textAlign: 'center',
textStyle: {
fontWeight: 'normal',
fontSize: '16',
color: colors[index][0],
textAlign: 'center',
},
}
);
seriesArr.push(
{
name: item.name,
type: 'pie',
clockWise: false,
radius: [55, 65],
itemStyle: {
normal: {
color: colors[index][0],
shadowColor: colors[index][0],
shadowBlur: 0,
label: {
show: false
},
labelLine: {
show: false
},
}
},
hoverAnimation: false,
center: [index * 25 + 12 +'%', '50%'],
data: [{
value: item.value,
label: {
normal: {
formatter: function(params){
return params.value+'%';
},
position: 'center',
show: true,
textStyle: {
fontSize: '20',
fontWeight: 'bold',
color: colors[index][0]
}
}
},
}, {
value: 100-item.value,
name: 'invisible',
itemStyle: {
normal: {
color: colors[index][1]
},
emphasis: {
color: colors[index][1]
}
}
}]
}
)
});
option = {
backgroundColor: "#fff",
title:titleArr,
series: seriesArr
}
var myChart = echarts.init(document.getElementById('main'));
myChart.setOption(option);
点击运行 》