option = {
backgroundColor: '#030c2b',
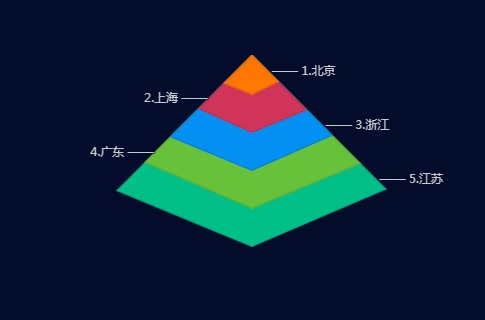
color: ["#00C088", "#67c23a", "#0490f2","#d03559", "#ff7600"],
tooltip: {
triggerOn: 'click'
},
radar: {
name: {
show: false
},
indicator: [{
name: 'A',
max: 100
},
{
name: 'B',
max: 100
},
{
name: 'C',
max: 100
},
{
name: 'D',
max: 100
},
{
name: 'E',
max: 100
},
{
name: 'F',
max: 100
},
{
name: 'G',
max: 100
},
{
name: 'H',
max: 100
}
],
center: ['50%', '20%'],
radius: '100%',
axisLine: {
show: false
},
splitLine: {
show: false
},
splitArea: {
show: false
}
},
series: [{
type: 'radar',
areaStyle: {
opacity: 1,
shadowBlur: 1,
shadowColor: 'rgba(0,0,0,.5)',
},
emphasis: {
areaStyle: {
opacity: 0
}
},
silent: true,
data: [{
value: [0, 0, 0, 100, 100, 99, 0, 0],
name: '江苏',
symbol: 'circle',
symbolSize: 1,
label: {
show: true,
position: [-5, -15],
formatter: function(point) {
if(point.value == 99)
return "—— 5." + point.name
else
return ''
},
}
},
{
value: [0, 0, 0, 79, 80, 80, 0, 0],
name: '广东',
symbol: 'circle',
symbolSize: 1,
label: {
show: true,
position: [-55, -15],
formatter: function(point) {
if(point.value == 79)
return "4." + point.name + " ——"
else
return ''
},
}
},
{
value: [0, 0, 0, 60, 60, 59, 0, 0],
name: '浙江',
symbol: 'circle',
symbolSize: 1,
label: {
show: true,
position: [-5, -15],
formatter: function(point) {
if(point.value == 59)
return "—— 3." + point.name
else
return ''
},
}
},
{
value: [0, 0, 0, 39, 40, 40, 0, 0],
name: '上海',
symbol: 'circle',
symbolSize: 1,
label: {
show: true,
position: [-55, -15],
formatter: function(point) {
if(point.value == 39)
return "2." + point.name + " ——"
else
return ''
},
}
},
{
value: [0, 0, 0, 20, 20, 19, 0, 0],
name: '北京',
symbol: 'circle',
symbolSize: 1,
label: {
show: true,
position: [-5, -15],
formatter: function(point) {
if(point.value == 19)
return "—— 1." + point.name
else
return ''
},
}
}
]
}],
itemStyle: {
emphasis: {
show: false,
shadowBlur: 10,
shadowOffsetX: 0,
shadowColor: 'rgba(0, 0, 0, 0.5)'
}
}
};
var myChart = echarts.init(document.getElementById('main'));
myChart.setOption(option);
点击运行 》