option = {
backgroundColor: '#030c2b',
grid: {
containLabel: true
},
tooltip: {
show: true,
formatter: function(params) {
return "车牌号: " + params.value[1] + '
' +
"距离上一站: " + params.value[2].toFixed(2) + '米
' +
"距离下一站: " + params.value[3].toFixed(2) + '米
';
}
},
singleAxis: [{
type: "value",
top: "80",
height: "20",
splitLine: {
show: false
},
interval: 1,
axisLabel: {
show: true,
margin: 20,
textStyle: {
fontSize: 14,
color: '#fff'
},
formatter: function(value, index) {
return value +1
}
},
min: 0,
max: 21
}, {
type: "category",
boundaryGap: false,
top: "120",
height: "20",
splitLine: {
show: false
},
axisLabel: {
interval: 0,
textStyle: {
fontSize: 18,
color: '#fff'
},
formatter: function(value, index) {
return value ? value.split("").join('\n') : ""; //竖排文字
}
},
axisTick: {
show: false
},
axisLine: {
show: false
},
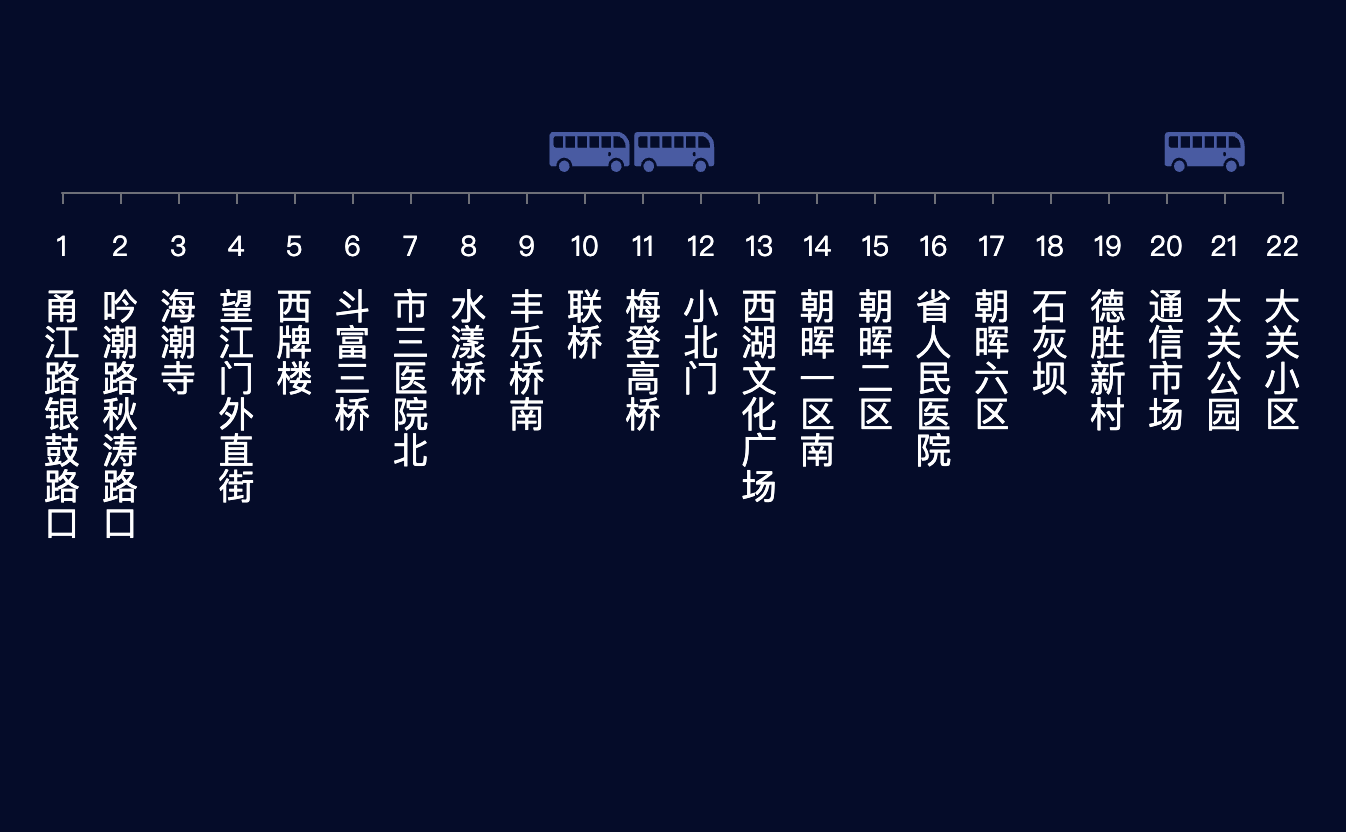
data: [
"甬江路银鼓路口",
"吟潮路秋涛路口",
"海潮寺",
"望江门外直街",
"西牌楼",
"斗富三桥",
"市三医院北",
"水漾桥",
"丰乐桥南",
"联桥",
"梅登高桥",
"小北门",
"西湖文化广场",
"朝晖一区南",
"朝晖二区",
"省人民医院",
"朝晖六区",
"石灰坝",
"德胜新村",
"通信市场",
"大关公园",
"大关小区"
]
}],
series: [{
singleAxisIndex: 0,
coordinateSystem: "singleAxis",
type: "scatter",
symbol: "path://M1024 476.279467c0 0 0 33.4848 0 41.591467 0 72.362667 0 136.6528 0 136.6528 0 15.479467-12.100267 28.040533-27.016533 28.040533l-41.284267 0c0-56.610133-45.8752-102.5024-102.4512-102.5024s-102.4512 45.8752-102.4512 102.5024L290.304 682.564267c-0.017067-56.610133-45.8752-102.5024-102.468267-102.5024-56.558933 0-102.434133 45.8752-102.4512 102.5024L27.0336 682.564267c-14.916267 0-27.016533-12.544-27.016533-28.040533L0.017067 318.173867C0.017067 290.423467 17.988267 273.066667 44.100267 273.066667c0 0 811.3152 0 844.032 0s98.4576 43.281067 124.125867 101.870933C1025.655467 406.289067 1024 476.279467 1024 476.279467zM170.786133 324.317867 78.574933 324.317867c-15.086933 0-27.323733 12.219733-27.323733 27.306667l0 81.834667c0 15.086933 12.2368 27.2896 27.323733 27.2896l92.2112 0L170.786133 324.317867zM324.471467 324.317867l-119.534933 0 0 136.413867 119.534933 0L324.471467 324.317867zM477.610667 324.317867l-119.005867 0 0 136.413867 119.005867 0L477.610667 324.317867zM631.210667 324.317867l-119.005867 0 0 136.413867 119.005867 0L631.210667 324.317867zM784.896 324.317867l-119.534933 0 0 136.413867 119.534933 0L784.896 324.317867zM784.8448 524.919467c0-7.0144-7.645867-12.6976-17.083733-12.6976s-17.066667 5.6832-17.066667 12.6976l0 25.361067c0 7.0144 7.6288 12.6976 17.066667 12.6976s17.083733-5.6832 17.083733-12.6976L784.8448 524.919467zM966.024533 404.155733c-11.008-46.728533-71.3728-79.837867-88.1152-79.837867-41.0112 0-58.845867 0-58.845867 0l0 136.413867L971.741867 460.8C971.741867 460.8 974.848 441.719467 966.024533 404.155733zM187.835733 614.2464c37.717333 0 68.3008 30.600533 68.3008 68.352 0 37.7344-30.583467 68.334933-68.3008 68.334933-37.7344 0-68.3008-30.600533-68.3008-68.334933C119.534933 644.846933 150.101333 614.2464 187.835733 614.2464zM853.265067 614.2464c37.717333 0 68.3008 30.600533 68.3008 68.352 0 37.7344-30.583467 68.334933-68.3008 68.334933-37.7344 0-68.317867-30.600533-68.317867-68.334933C784.9472 644.846933 815.530667 614.2464 853.265067 614.2464z",
symbolSize: [40, 20],
symbolOffset: [
0,
"-50%"
],
data: [
[
3.589386750921445,
"浙A00009",
568.6717545642821,
396.18155046034326
],
[
4.743669092493133,
"浙A00002",
327.82814095711046,
112.99714580863974
],
[
13.796138425253247,
"浙A00007",
349.73159785779444,
89.55331386662965
]
]
}, {
singleAxisIndex: 1,
coordinateSystem: "singleAxis",
type: "scatter",
symbolSize: 0,
data: [[0],[1],[2],[3],[4],[5],[6],[7],[8],[9],[10],[11],[12],[13],[14],[15],[16],[17],[18],[19],[20],[21]]
}]
};
setInterval(function() {
echarts.util.each(option.series[0].data, function(item) {
item[0] += Math.random();
if (item[0] > 21) {
item[0] = 21;
}
});
myChart.setOption(option);
}, 500)
点击运行 》