myChart.setOption(option = {
backgroundColor: '#030c2b',
tooltip: {
trigger: 'item',
formatter: '{b}'
},
series: [{
type: 'tree',
name: '治安管理工作',
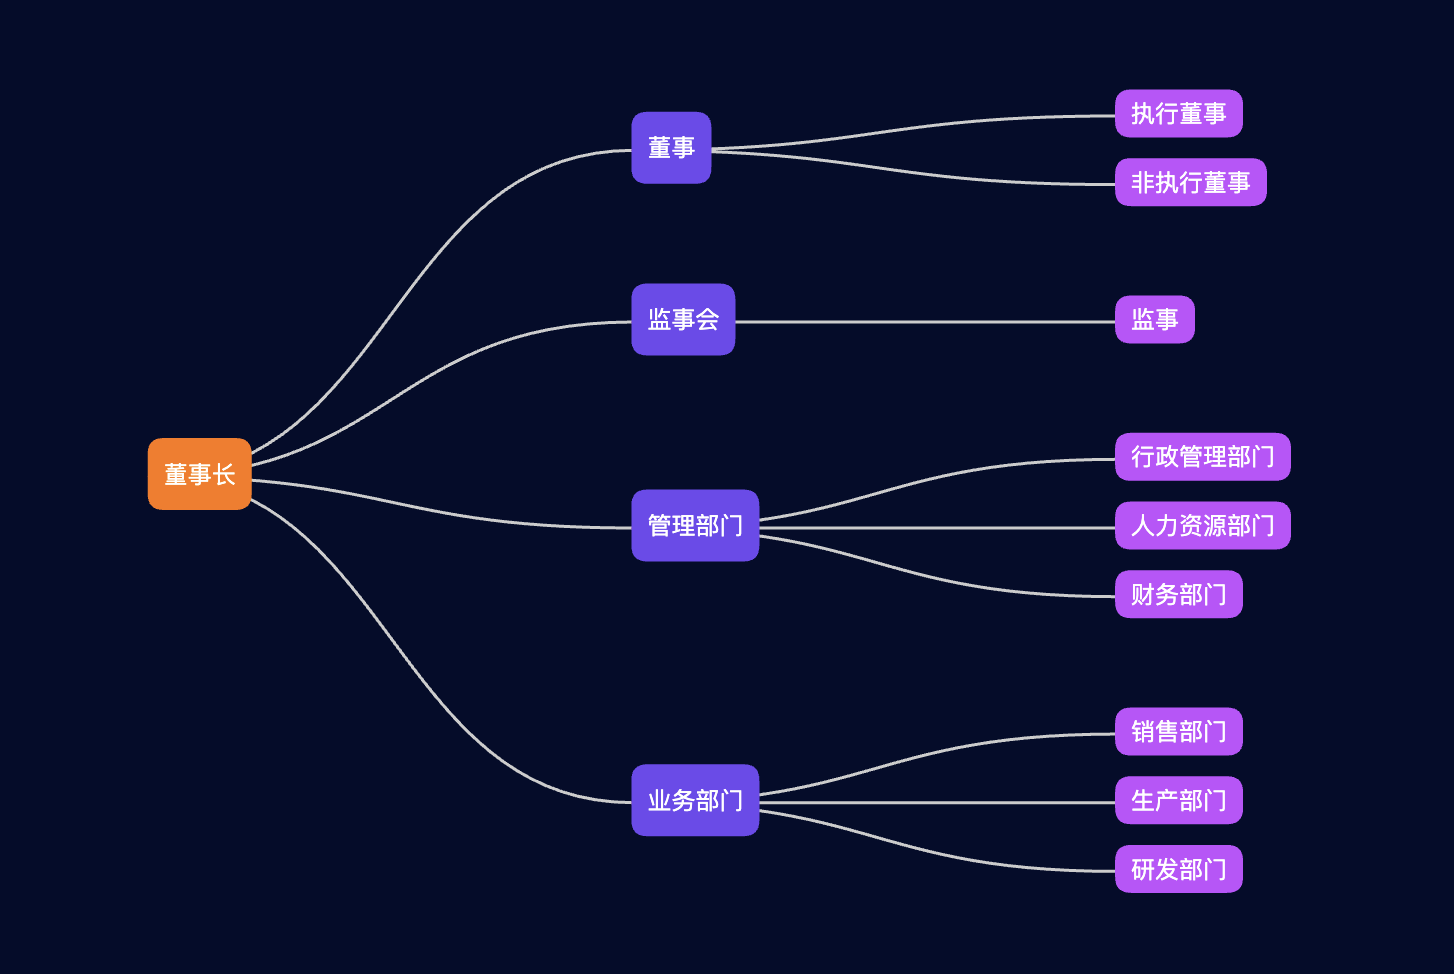
data: [{
name: "董事长",
label: {
normal: {
backgroundColor: '#ff7600'
}
},
children: [{
name: "董事",
children: [{
name: "执行董事"
},{
name: "非执行董事"
}]
}, {
name: "监事会",
children: [{
name: "监事"
}]
}, {
name: "管理部门",
children: [{
name: "行政管理部门"
},{
name: "人力资源部门"
},{
name: "财务部门"
}]
}, {
name: "业务部门",
children: [{
name: "销售部门"
},{
name: "生产部门"
},{
name: "研发部门"
}]
}]
}],
top: '8%',
right: '30%',
symbolSize: 1,
initialTreeDepth: 10,
label: {
normal: {
position: 'center',
verticalAlign: 'middle',
align: 'left',
backgroundColor: '#7049f0',
color: '#fff',
borderRadius: [8, 8, 8, 8],
padding: 3,
formatter: [
'{box|{b}}'
].join('\n'),
rich: {
box: {
height: 30,
color: '#fff',
padding: [0, 5],
align: 'center'
}
}
}
},
leaves: {
label: {
normal: {
position: 'center',
verticalAlign: 'middle',
align: 'left',
backgroundColor: '#c44eff',
formatter: [
'{box|{b}}'
].join('\n'),
rich: {
box: {
height: 18,
color: '#fff',
padding: [0, 5],
align: 'center'
}
}
}
}
},
expandAndCollapse: true,
animationDuration: 550,
animationDurationUpdate: 750
}
]
});
点击运行 》