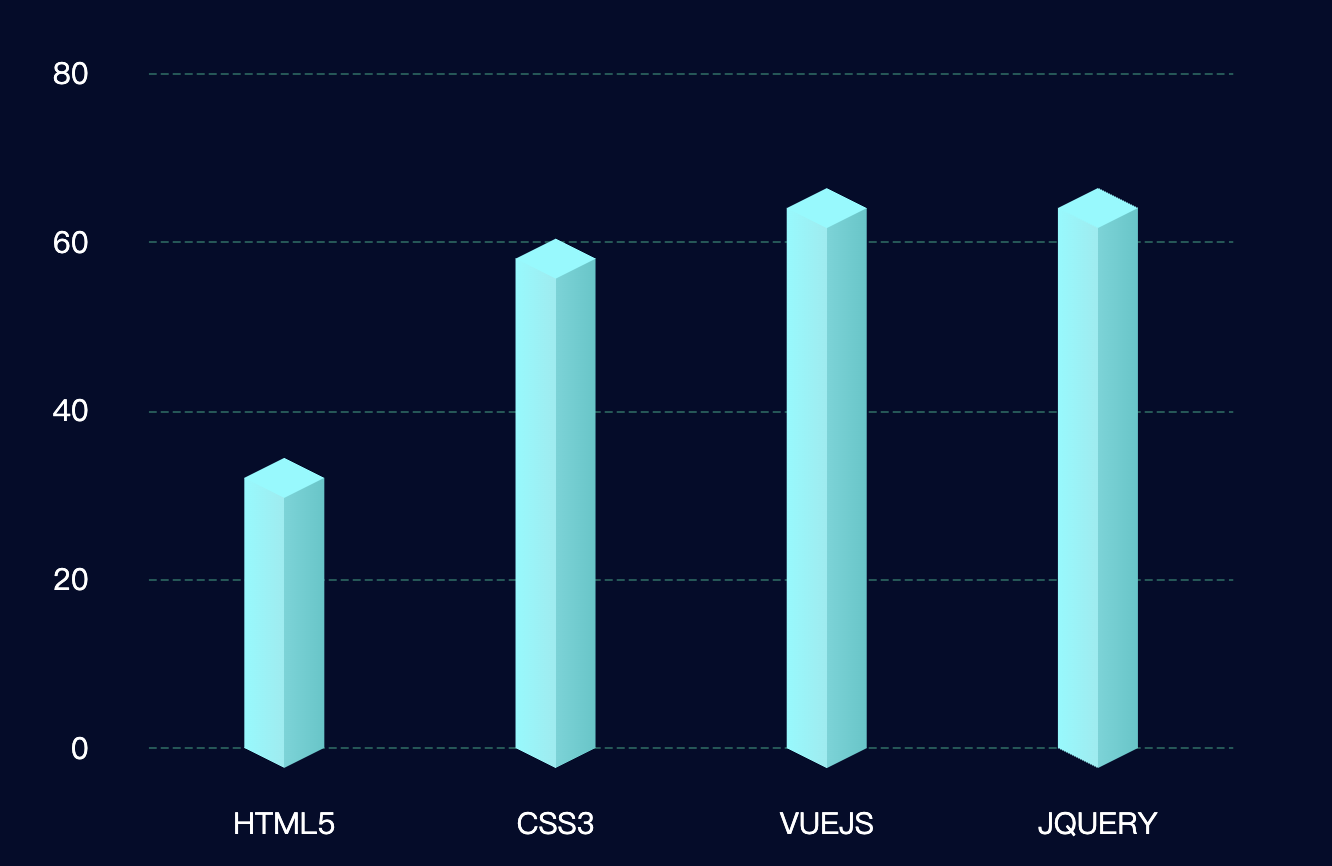
let yList = [32, 58, 64, 64, ];
let xList = [10, 55, 44, 55, ];
let xData = ['HTML5', 'CSS3', 'VUEJS', 'JQUERY'];
let color = ['#CC1CAA', '#8D67FF', '#00FFFF', '#48DE13', '#FFC516', '#DC3E14', '#8E16F8'];

dom = 800;
barWidth = dom / 20;
let colors = []
for(let i = 0;i<4;i++){
  colors.push({
    type: 'linear',
    x: 0,
    x2: 1,
    y: 0,
    y2: 0,
    colorStops: [
    {
      offset: 0,
      color: '#73fcff' // 最左边
    }, {
      offset: 0.5,
      color: '#86eef1' // 左边的右边 颜色
    }, {
      offset: 0.5,
      color: '#5ad6d9' // 右边的左边 颜色
    }, {
      offset: 1,
      color: '#3dc8ca'
    }]
  })
}
option = {
  backgroundColor: '#030c2b',
  tooltip: {
    trigger: 'axis',
    formatter: "{b} : {c}",
    axisPointer: {
      type: 'shadow'
    }
  },
  grid: {
    left: '12%',
    right: '8%',
    top: '10%',
    bottom: '15%',
  },
  xAxis: {
    data: xData,
    type: 'category',
    axisLine: {
      show: false,
      lineStyle: {
        color: 'rgba(255,255,255,1)',
        shadowColor: 'rgba(255,255,255,1)',
        shadowOffsetX: '20',
      },
      symbol: ['none', 'arrow'],
      symbolOffset: [0, 25]
    },
    splitLine: {
      show: false,
    },
    axisTick: {
      show: false
    },
    axisLabel: {
      margin: 30,
      fontSize: 15,
    },
  },
  yAxis: {
    show: true,
    splitNumber: 4,
    axisLine: {
      show: false,
    },
    splitLine: {
      show: true,
      lineStyle: {
        type:'dashed',
        color: '#075858'
      },
    },
    axisLabel: {
      color: '#FFFFFF',
      margin: 30,
      fontSize:15
    }
  },
  series: [
    {
      type: 'bar',
      barWidth: barWidth,
      itemStyle: {
        normal: {
          color: function(params) {
            return colors[params.dataIndex % 7];
          }
        }
      },
      label: {
        show: false,
        position: [barWidth / 2, -(barWidth + 20)],
        color: '#ffffff',
        fontSize: 14,
        fontStyle: 'bold',
        align: 'center',
      },
      data: yList
    },
    {
      z: 2,
      type: 'pictorialBar',
      data: yList,
      symbol: 'diamond',
      symbolOffset: [0, '50%'],
      symbolSize: [barWidth, barWidth * 0.5],
      itemStyle: {
        normal: {
          color: function(params) {
            return colors[params.dataIndex % 7];
          },
        }
      },
    },
    {
      z: 3,
      type: 'pictorialBar',
      symbolPosition: 'end',
      data: yList,
      symbol: 'diamond',
      symbolOffset: [0, '-50%'],
      symbolSize: [barWidth, barWidth * 0.5],
      itemStyle: {
        normal: {
          borderWidth: 0,
          color: function(params) {
            return colors[params.dataIndex % 7].colorStops[0].color;
          },

        }
      },
    },
  ],
};
点击运行 》