option = {
grid: {
bottom: 50,
left: 80,
top: 80,
right: 50,
},
xAxis: [{
type: 'category',
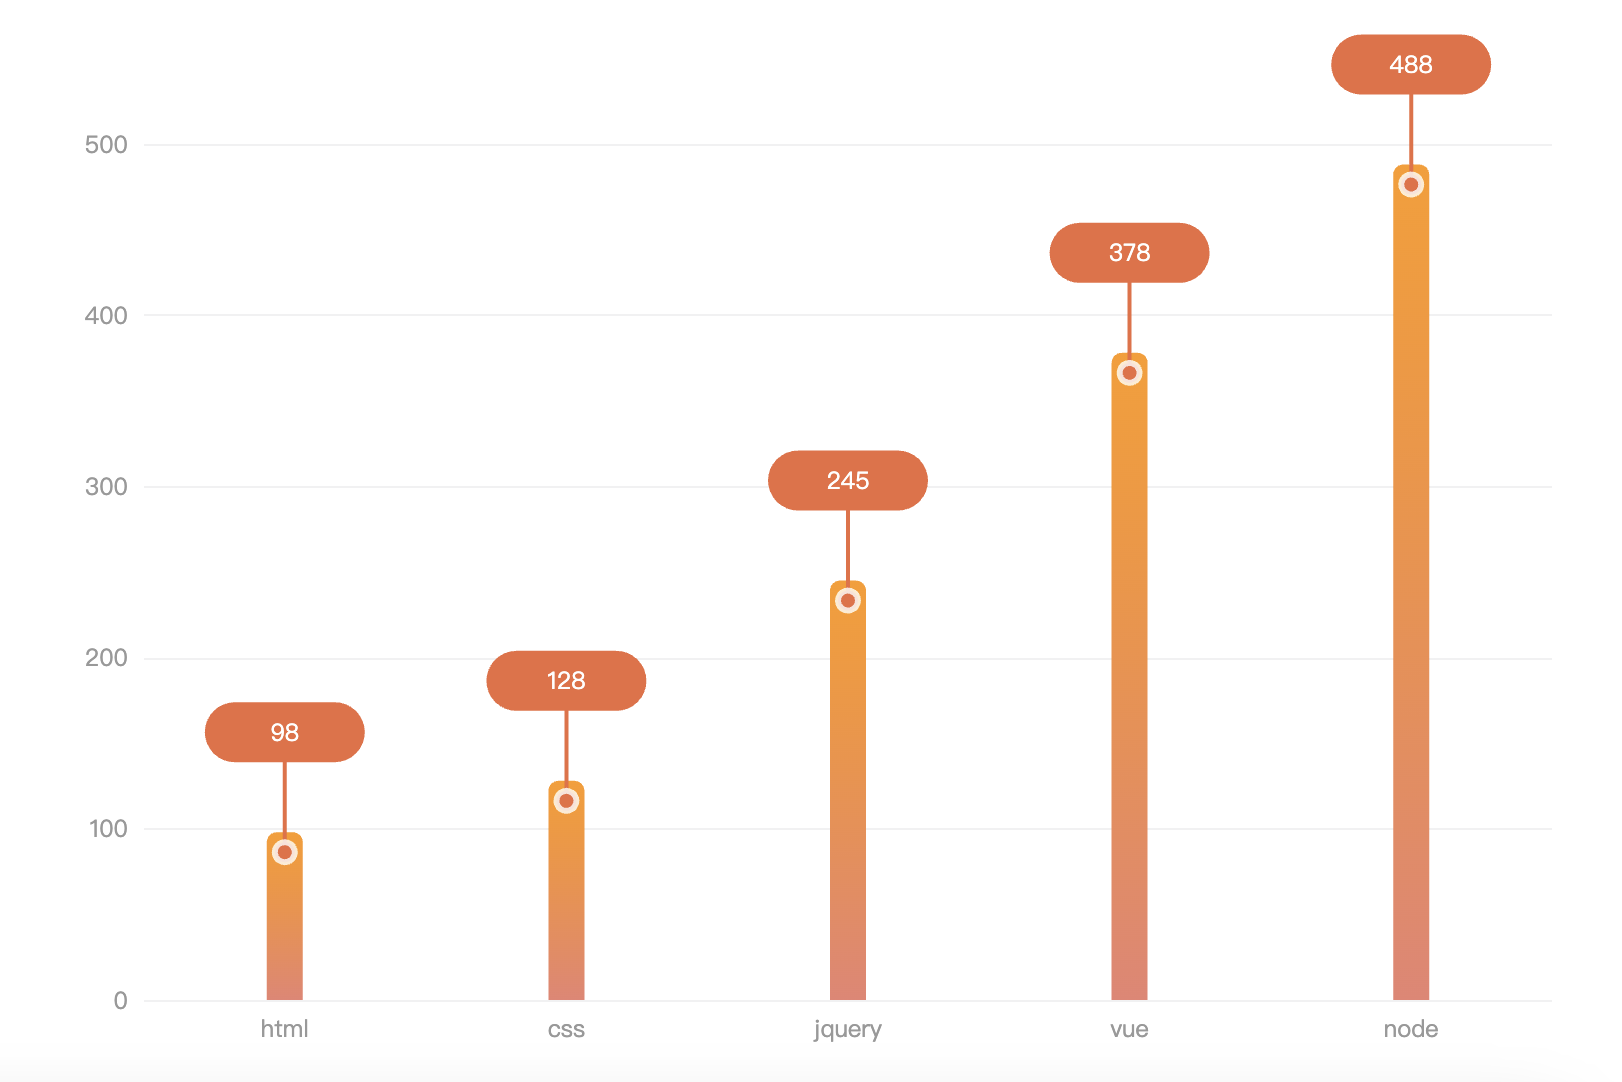
data: ['html', 'css', 'jquery', 'vue', 'node'],
axisLine: {
show: false
},
axisTick: {
show: false
},
axisLabel: {
color: '#999999',
fontSize: 12
}
}],
yAxis: [{
type: 'value',
axisLine: {
show: false
},
axisTick: {
show: false
},
splitLine: {
lineStyle: {
color: '#f1f1f2'
}
},
axisLabel: {
color: '#999999',
fontSize: 12
}
}],
series: [{
name: '访问量',
type: 'bar',
data: [98, 128, 245, 378, 488],
barWidth: 18,
itemStyle: {
normal: {
barBorderRadius: [5, 5, 0, 0],
color: new echarts.graphic.LinearGradient(0, 0, 0, 1, [{
offset: 0,
color: "rgb(255,154,22)"
},
{
offset: 1,
color: "rgb(234,130,113)"
}
])
}
},
label: {
normal: {
show: true,
lineHeight: 30,
width: 80,
height: 30,
backgroundColor: '#ec6c3f',
borderRadius: 200,
position: ['-31', '-65'],
formatter: [
'{a|{c}}\n',
'{b|}\n',
'{d|}',
].join(''),
rich: {
d: {
color: '#ec6c3f',
align: 'center',
width: 10,
height: 10,
backgroundColor: '#ec6c3f',
borderWidth: 3,
borderColor: 'rgba(255,255,255,.8)',
borderRadius: 100
},
a: {
color: '#fff',
align: 'center',
},
b: {
width: 1,
height: 50,
borderWidth: 1,
borderColor: '#ec6c3f',
align: 'center'
},
}
}
}
}]
};
点击运行 》