var screenSymbol = 'path://M896 768c16.378 0 32.758-6.248 45.254-18.746C953.752 736.758 960 720.378 960 704L960 192c0-16.376-6.248-32.758-18.746-45.254C928.758 134.248 912.378 128 896 128L128 128c-16.378 0-32.758 6.248-45.254 18.746S64 175.62 64 192l0 512c0 16.378 6.248 32.758 18.746 45.254C95.242 761.752 111.622 768 128 768l320 0 0 96-112 0c-4.094 0-8.19 1.562-11.314 4.688C321.562 871.81 320 875.904 320 880l0 32c0 4.098 1.562 8.192 4.686 11.314 3.124 3.126 7.218 4.686 11.314 4.686l352 0c4.094 0 8.19-1.56 11.314-4.686 3.124-3.126 4.686-7.216 4.686-11.314l0-32c0-4.096-1.562-8.19-4.686-11.312-3.126-3.126-7.22-4.688-11.314-4.688l-112 0 0-96L896 768zM544 705c0 17.666-14.328 32-32 32s-32-14.326-32-32c0-17.672 14.328-32 32-32S544 687.328 544 705zM896 224l0 163L896 608l0 32-32 0L160 640 128 640l0-32L128 387 128 224c0-8.19 3.124-16.376 9.374-22.626C143.622 195.124 151.81 192 160 192l704 0c8.19 0 16.378 3.126 22.626 9.376C892.876 207.62 896 215.81 896 224z';
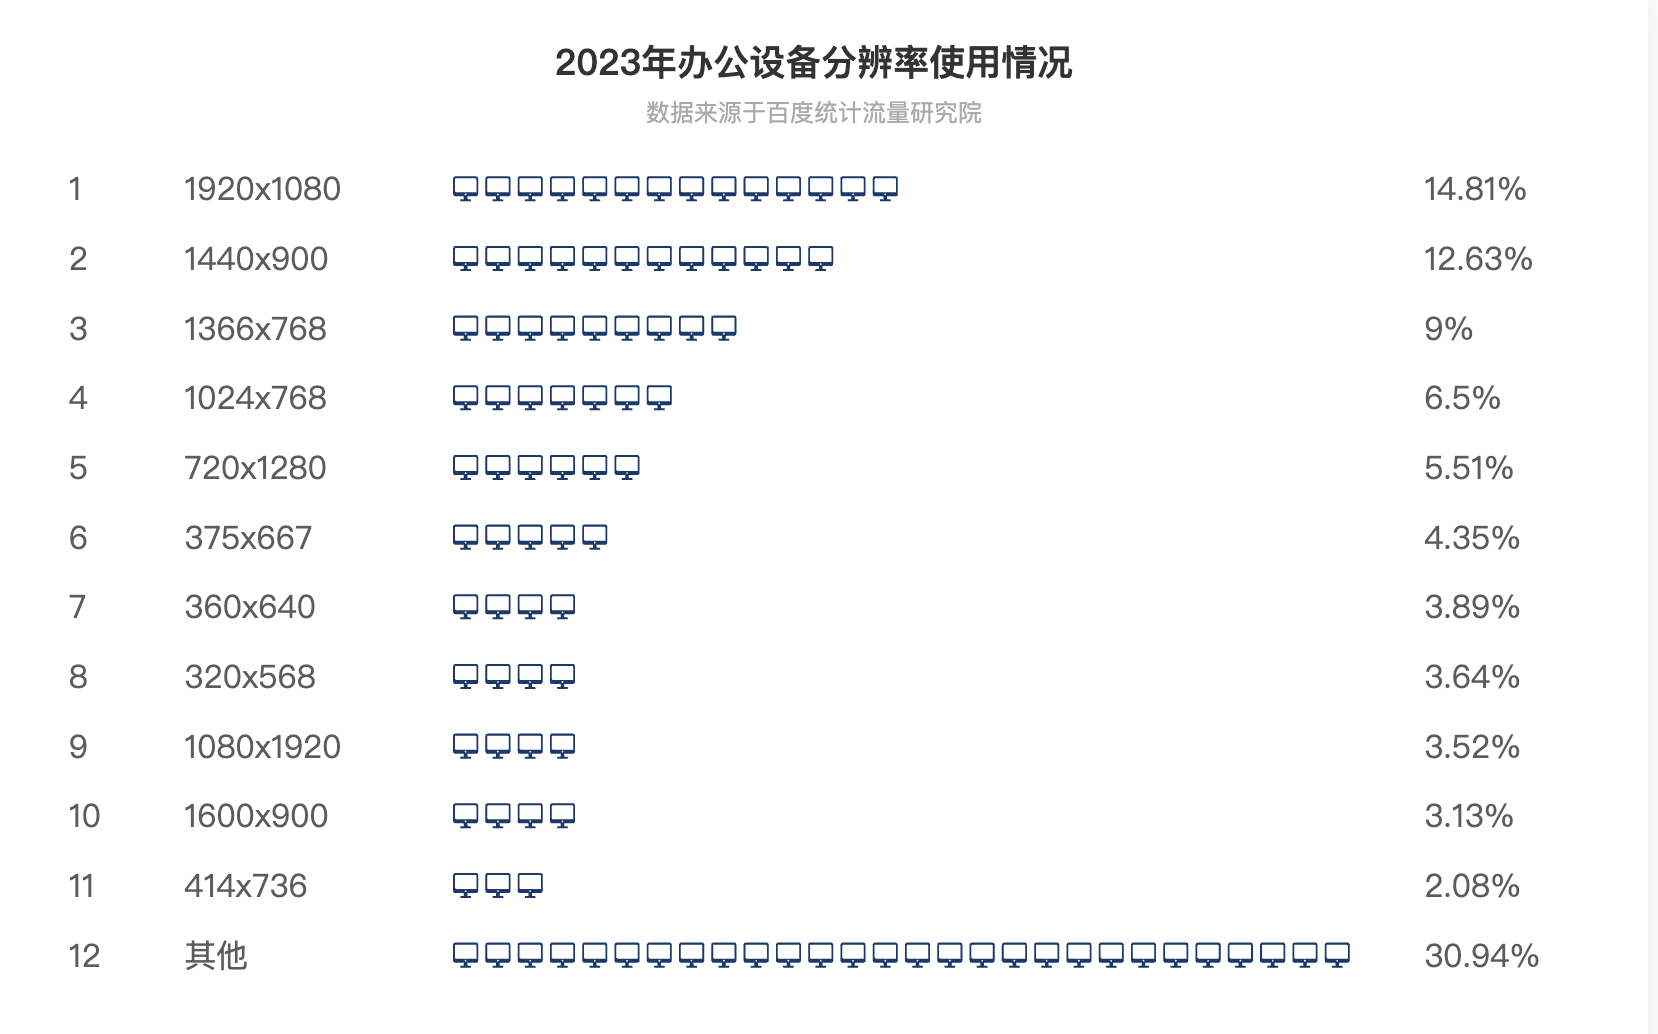
var categories = ['1920x1080', '1440x900', '1366x768', '1024x768', '720x1280', '375x667', '360x640', '320x568', '1080x1920', '1600x900', '414x736', '其他'];
var data = [14.81, 12.63, 9, 6.50, 5.51, 4.35, 3.89, 3.64, 3.52, 3.13, 2.08, 30.94];
var dataMax = Math.max.apply(Math, data);
var labelSetting = {
normal: {
show: true,
position: 'right',
textStyle: {
fontSize: 16,
color: '#333'
},
formatter: function (params) {
return params.value[2];
}
},
emphasis: {
textStyle: {
fontSize: 16,
color: 'red'
}
}
};
var itemStyleSetting = {normal: {color: 'transparent'}};
option = {
title: {
left: 'center',
y: 20,
text: '2023年办公设备分辨率使用情况',
subtext: '数据来源于百度统计流量研究院',
sublink: 'http://tongji.baidu.com/data/screen'
},
tooltip: {
trigger: 'axis',
showContent: false,
axisPointer: {
type: 'shadow'
}
},
grid: {
left: 20,
right: 20,
y: 80,
},
yAxis: {
data: categories,
inverse: true,
axisLine: {show: false},
axisTick: {show: false},
axisLabel: {show: false}
},
xAxis: {
splitLine: {show: false},
axisLabel: {show: false},
axisTick: {show: false},
axisLine: {show: false},
min: -15
},
series: [{
name: '2023',
type: 'pictorialBar',
symbolRepeat: true,
symbolSize: ['60%', '60%'],
symbol: screenSymbol,
itemStyle: {
normal: {
color: '#0c3b6d'
},
emphasis: {
color: 'red'
}
},
barCategoryGap: '40%',
data: data
}, {
name: 'percentLabel',
type: 'scatter',
silent: true,
hoverAnimation: false,
itemStyle: itemStyleSetting,
label: labelSetting,
data: echarts.util.map(data, function (item, index) {
return [dataMax + 2, index, item + '%'];
})
}, {
name: 'resolution',
type: 'scatter',
silent: true,
hoverAnimation: false,
itemStyle: itemStyleSetting,
label: labelSetting,
data: echarts.util.map(categories, function (item, index) {
return [-10, index, item];
})
}, {
name: 'order',
type: 'scatter',
silent: true,
hoverAnimation: false,
itemStyle: itemStyleSetting,
label: labelSetting,
data: echarts.util.map(categories, function (item, index) {
return [-14, index, index + 1]; //index+1是序号
})
}]
};
点击运行 》