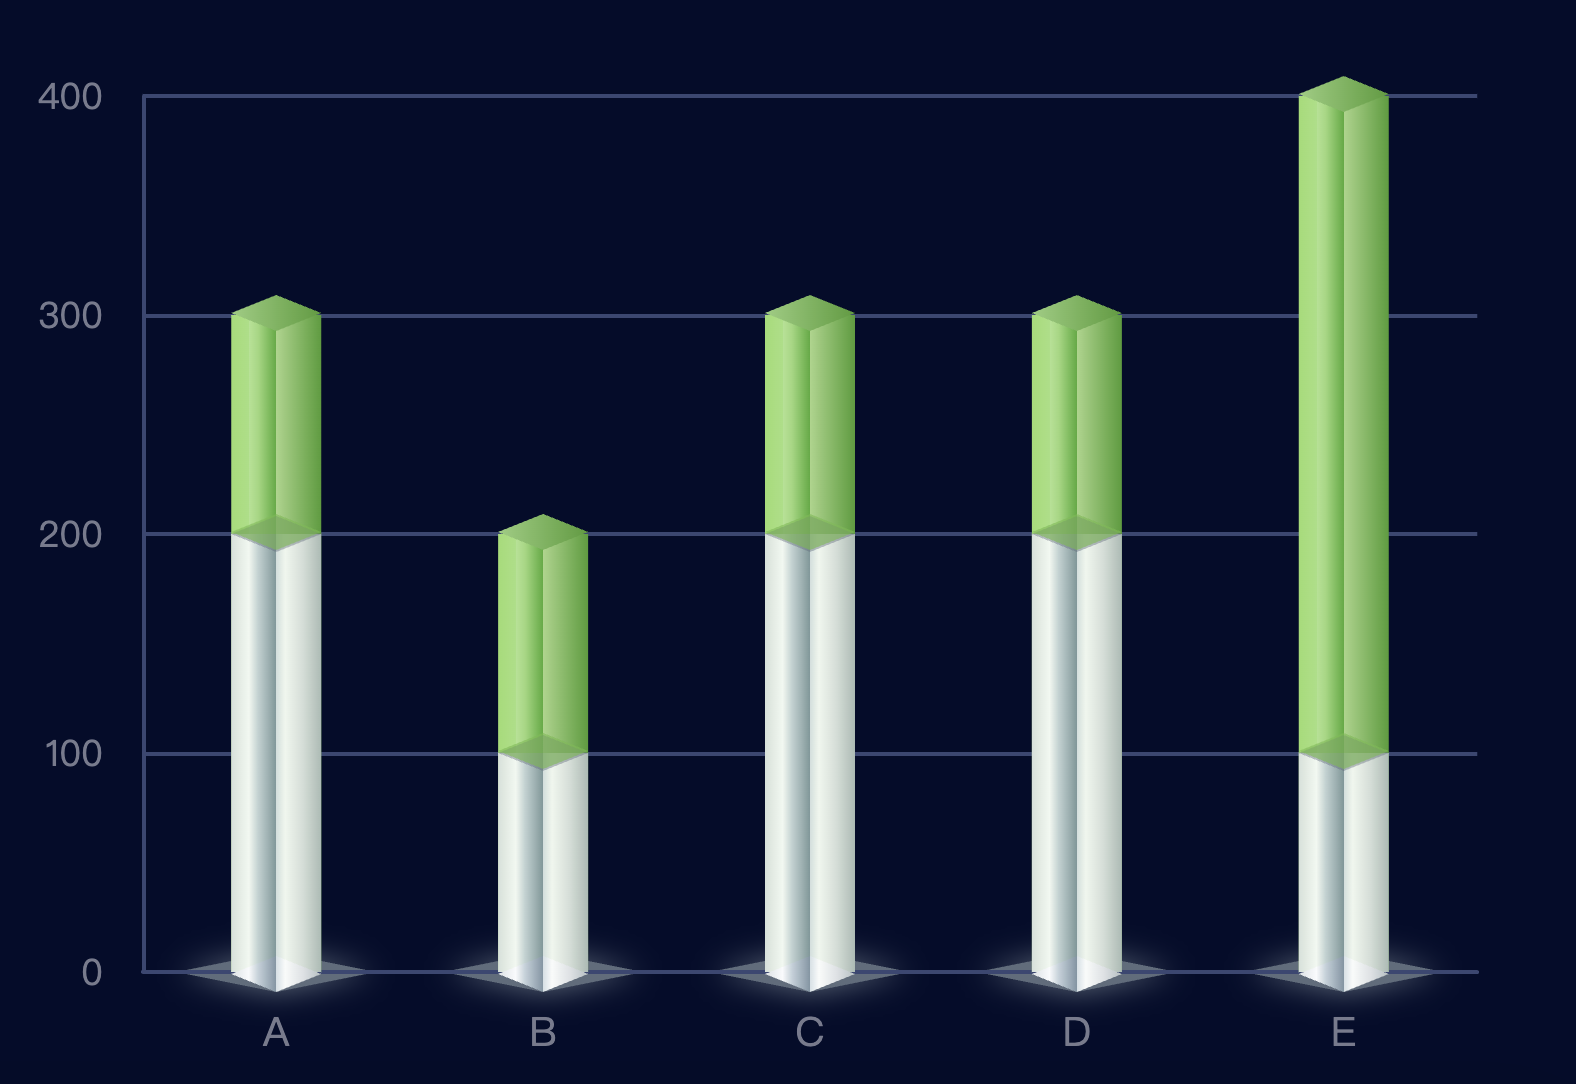
var data1 = [200, 100, 200, 200, 100];
var data2 = [300, 200, 300, 300, 400];
option = {
  backgroundColor: "#030c2b",
  xAxis: {
    axisLabel: {
      interval: 0,
      textStyle: {
        color: '#777b8f',
        fontSize: 20
      },
      margin: 20,
    },
    splitLine: {
      show: false
    },
    axisLine: {
      lineStyle: {
        color: '#394773',
        width: 2,
      }
    },
    splitArea: {
      show: false,
    },
    axisTick: {
      show: false
    },
    data: ['A', 'B', 'C', 'D', 'E', ]
  },
  yAxis: {
    axisLine: {
      lineStyle: {
        color: '#394773',
        width: 2,
      }
    },
    axisLabel: {
      interval: 0,
      textStyle: {
        color: '#777b8f',
        fontSize: 18
      },
      margin: 20,
    },
    splitLine: {
      show: true,
      lineStyle: {
        color: '#394773',
        width: 2,
      }
    },
    axisTick: {
      show: false
    },
  },
  series: [{
      "name": "",
      "type": "pictorialBar",
      symbol: 'diamond',
      "symbolSize": [45, 18],
      "symbolOffset": [0, -10],
      "z": 12,
      "symbolPosition": "end",
      itemStyle: {
        color: {
          type: 'linear',
          x: 0,
          y: 0,
          x2: 1,
          y2: 0,
          colorStops: [{
            offset: 0,
            color: '#95ce7d'
          }, {
            offset: 1,
            color: '#4f9c34'
          }],
          global: false
        },
        opacity: 1,
      },
      "data": data2
    },
    {
      name: '2019',
      type: 'bar',
      barWidth: 45,
      barGap: '-100%',
      z: 0,
      itemStyle: {
        normal: {
          color: new echarts.graphic.LinearGradient(0, 0, 1, 0, [{
              offset: 0,
              color: "#99dd6e"
            },
            {
              offset: 0.2,
              color: "#a2e07f"
            },
            {
              offset: 0.2,
              color: "#ade38f"
            },
            {
              offset: 0.3,
              color: "#9bd87b"
            },
            {
              offset: 0.5,
              color: "#4eab36"
            }, {
              offset: 0.5,
              color: "#a6d587"
            },
            {
              offset: 1,
              color: "#4a9d31"
            }
          ]),
        }
      },

      data: data2
    },
    {
      "name": "",
      "type": "pictorialBar",
      symbol: 'diamond',
      "symbolSize": [45, 18],
      "symbolOffset": [0, -10],
      "z": 12,
      itemStyle: {
        opacity: .6,
        color: '#6ebb49',
        shadowColor: 'rgba(95, 108, 125, .7)',
        shadowBlur: 0,
        shadowOffsetX: 0,
        shadowOffsetY: 1
      },
      "symbolPosition": "end",
      "data": data1
    },
    {
      name: '2020',
      type: 'bar',
      barWidth: 45,

      barGap: '-100%',
      itemStyle: {

        normal: {
          opacity: .9,
          color: new echarts.graphic.LinearGradient(0, 0, 1, 0, [{
              offset: 0,
              color: "#dce1e5"
            },
            {
              offset: 0.2,
              color: "#fafbfd"
            },
            {
              offset: 0.2,
              color: "#f7f8fa"
            },
            {
              offset: 0.3,
              color: "#c3d1da"
            },
            {
              offset: 0.5,
              color: "#8096a4"
            }, {
              offset: 0.5,
              color: "#d5e0e6"
            }, {
              offset: 0.6,
              color: "#f9fbfa"
            }, {
              offset: 0.8,
              color: "#dde1e4"
            },
            {
              offset: 1,
              color: "#b4bfc3"
            }
          ]),
        }
      },

      data: data1
    },
    {
      "name": "",
      "type": "pictorialBar",
      symbol: 'diamond',
      "symbolSize": [45, 18],
      "symbolOffset": [0, 10],
      "z": 12,
      itemStyle: {
        opacity: 1,
        color: new echarts.graphic.LinearGradient(0, 0, 1, 0, [{
            offset: 0,
            color: "#dce1e5"
          },
          {
            offset: 0.2,
            color: "#fafbfd"
          },
          {
            offset: 0.2,
            color: "#f7f8fa"
          },
          {
            offset: 0.3,
            color: "#c3d1da"
          },
          {
            offset: 0.5,
            color: "#8096a4"
          }, {
            offset: 0.5,
            color: "#d5e0e6"
          }, {
            offset: 0.6,
            color: "#f9fbfa"
          }, {
            offset: 0.8,
            color: "#dde1e4"
          },
          {
            offset: 1,
            color: "#b4bfc3"
          }
        ]),
        shadowColor: 'rgba(95, 108, 125, 1)',
      },
      "data": [1, 1, 1, 1, 1]
    },
    {
      "type": "pictorialBar",
      symbol: 'diamond',
      "symbolSize": [100, 20],
      "symbolOffset": [0, 10],
      "z": 0,
      itemStyle: {
        opacity: 1,
        color: 'rgba(95, 108, 125, 1)',
        shadowColor: 'rgba(95, 108, 125, 1)',
        shadowBlur: 15,
        shadowOffsetX: 0,
        shadowOffsetY: 0
      },
      "data": [1, 1, 1, 1, 1]
    },
  ]
};
点击运行 》