var lineitemStyle = {
normal: {
color: '#FF8432',
borderColor: "#fff",
borderWidth: 2,
shadowColor: 'rgba(0, 0, 0, .6)',
shadowBlur: 0,
shadowOffsetY: 2,
shadowOffsetX: 2,
},
};
option = {
grid: {
top: 50,
left: 20,
right: 20,
bottom: 90
},
dataZoom: [{
show: false,
height: 30,
xAxisIndex: [0],
bottom: 0,
type: 'slider',
start: 1,
end: 100,
handleIcon: 'path://M306.1,413c0,2.2-1.8,4-4,4h-59.8c-2.2,0-4-1.8-4-4V200.8c0-2.2,1.8-4,4-4h59.8c2.2,0,4,1.8,4,4V413z',
handleSize: '110%',
handleStyle: {
color: '#555'
}
}],
xAxis: {
axisLine: {
show: false
},
axisTick: {
show: false
},
axisLabel: {
textStyle: {
color: "#fff",
backgroundColor: '#FF8432',
padding: 10,
borderColor: 'rgba(255, 255, 255, .3)',
borderWidth: '10',
},
},
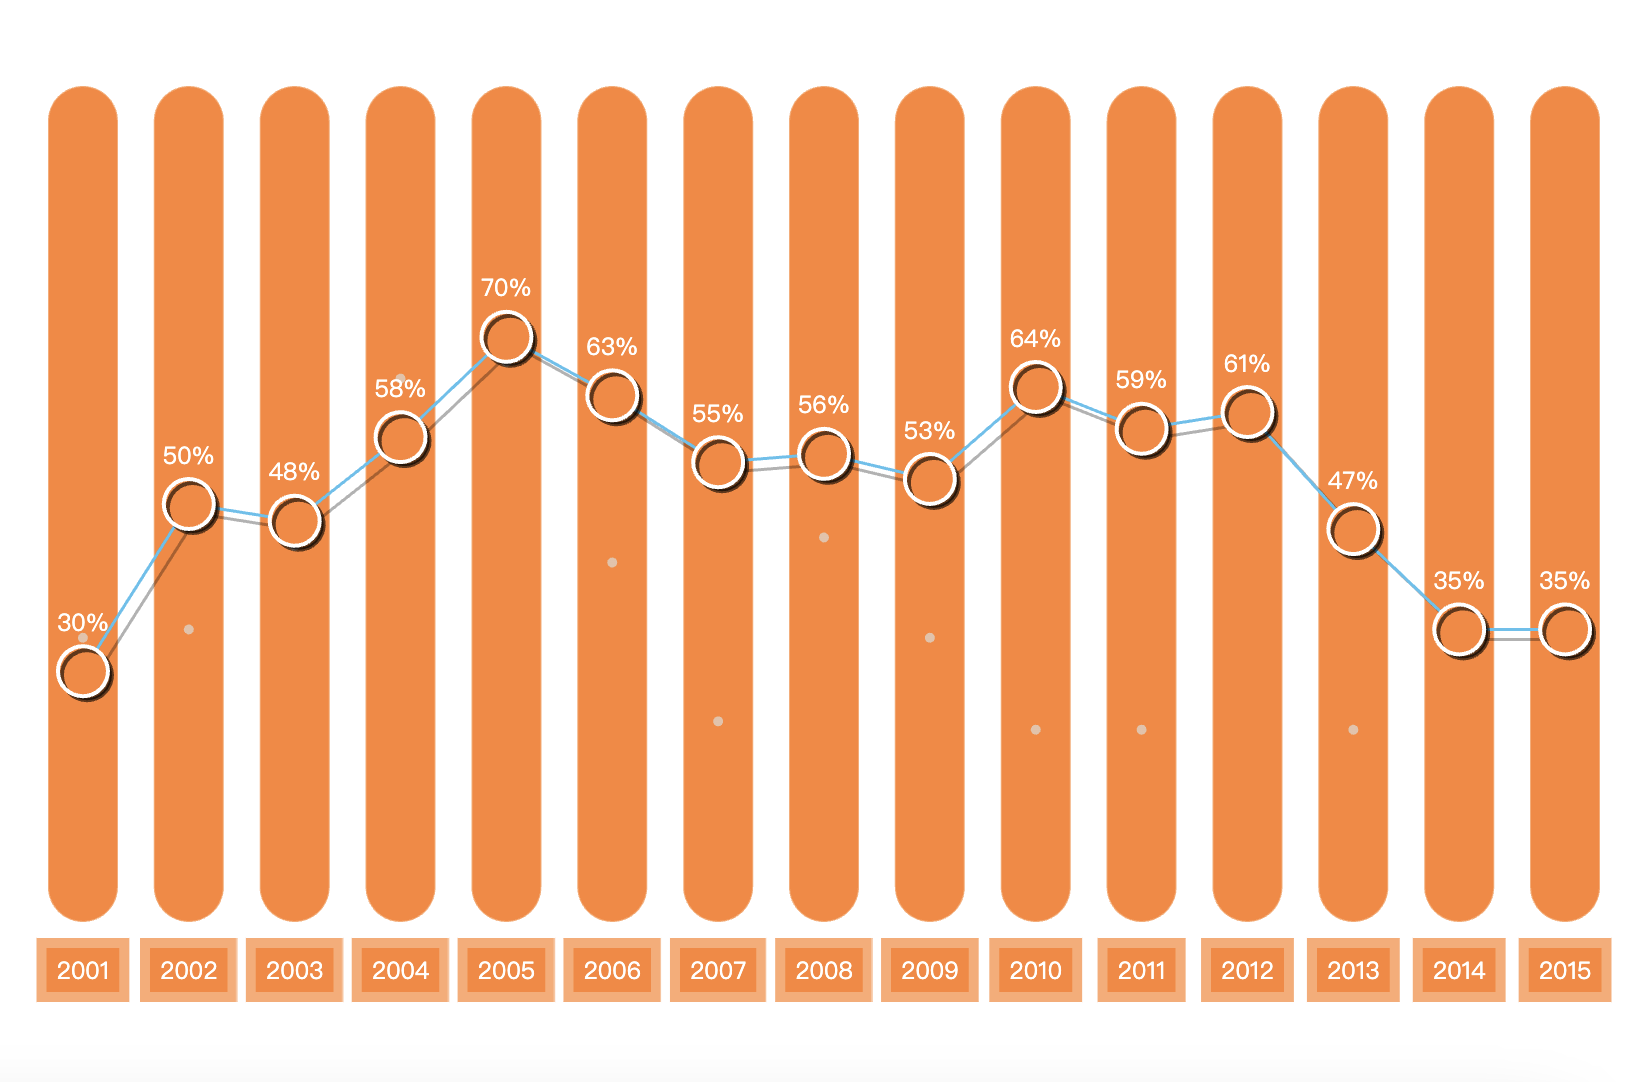
data: ['2001', '2002', '2003', '2004', '2005', '2006', '2007', '2008', '2009', '2010', '2011', '2012','2013','2014','2015'],
},
yAxis: {
splitLine: {
show: false
},
axisLabel: {
show: false
},
axisTick: {
show: false
},
axisLine: {
show: false,
},
},
series: [{
type: 'scatter',
symbolSize: 5,
itemStyle: {
color: {
type: 'radial',
r: 1,
colorStops: [{
offset: 0,
color: '#dddd'
}, {
offset: 1,
color: '#dddd'
}],
global: false
},
},
silent: true,
data: [34, 35, 45, 65, 67, 43, 24, 46, 34, 23, 23, 63,23]
}, {
name: '拆线',
type: 'line',
stack: '总量',
symbolSize: 25,
symbol: 'circle',
label: {
normal: {
show: true,
position: 'top',
formatter: "{c}%",
color: '#fff',
}
},
itemStyle: lineitemStyle,
lineStyle: {
normal: {
color: '#52c1ee',
width: 1.5,
shadowColor: 'rgba(0,0,0,.3)',
shadowBlur: 0,
shadowOffsetY: 5,
shadowOffsetX: 5,
}
},
data: [30, 50, 48, 58, 70, 63, 55, 56, 53, 64, 59, 61, 47, 35, 35]
}, {
name: '柱子',
type: 'bar',
barGap: '-100%',
barWidth: 35,
label: {
normal: {
color: '#00f3fb'
}
},
itemStyle: {
normal: {
borderColor: 'rgba(255, 255, 255, .3)',
borderWidth: '1',
barBorderRadius: 25,
color: '#FF8432',
}
},
z: -12,
data: [100,100,100, 100, 100, 100, 100, 100, 100, 100, 100, 100, 100, 100, 100]
}]
};
点击运行 》