var category = [];
var dottedBase = +new Date();
var lineData = [];
var barData1 = [];
var barData2 = [];
for (var i = 0; i < 30; i++) {
var date = new Date(dottedBase += 1000 * 3600 * 24);
category.push([
date.getFullYear(),
date.getMonth() + 1,
date.getDate()
].join('-'));
var b = Math.floor(Math.random() * 500);
var d = Math.floor(Math.random() * (-500));
barData1.push(b)
barData2.push(d)
}
option = {
backgroundColor: '#030c2b',
tooltip: {
trigger: 'axis',
axisPointer: {
type: 'shadow',
label: {
show: true,
backgroundColor: '#333'
}
}
},
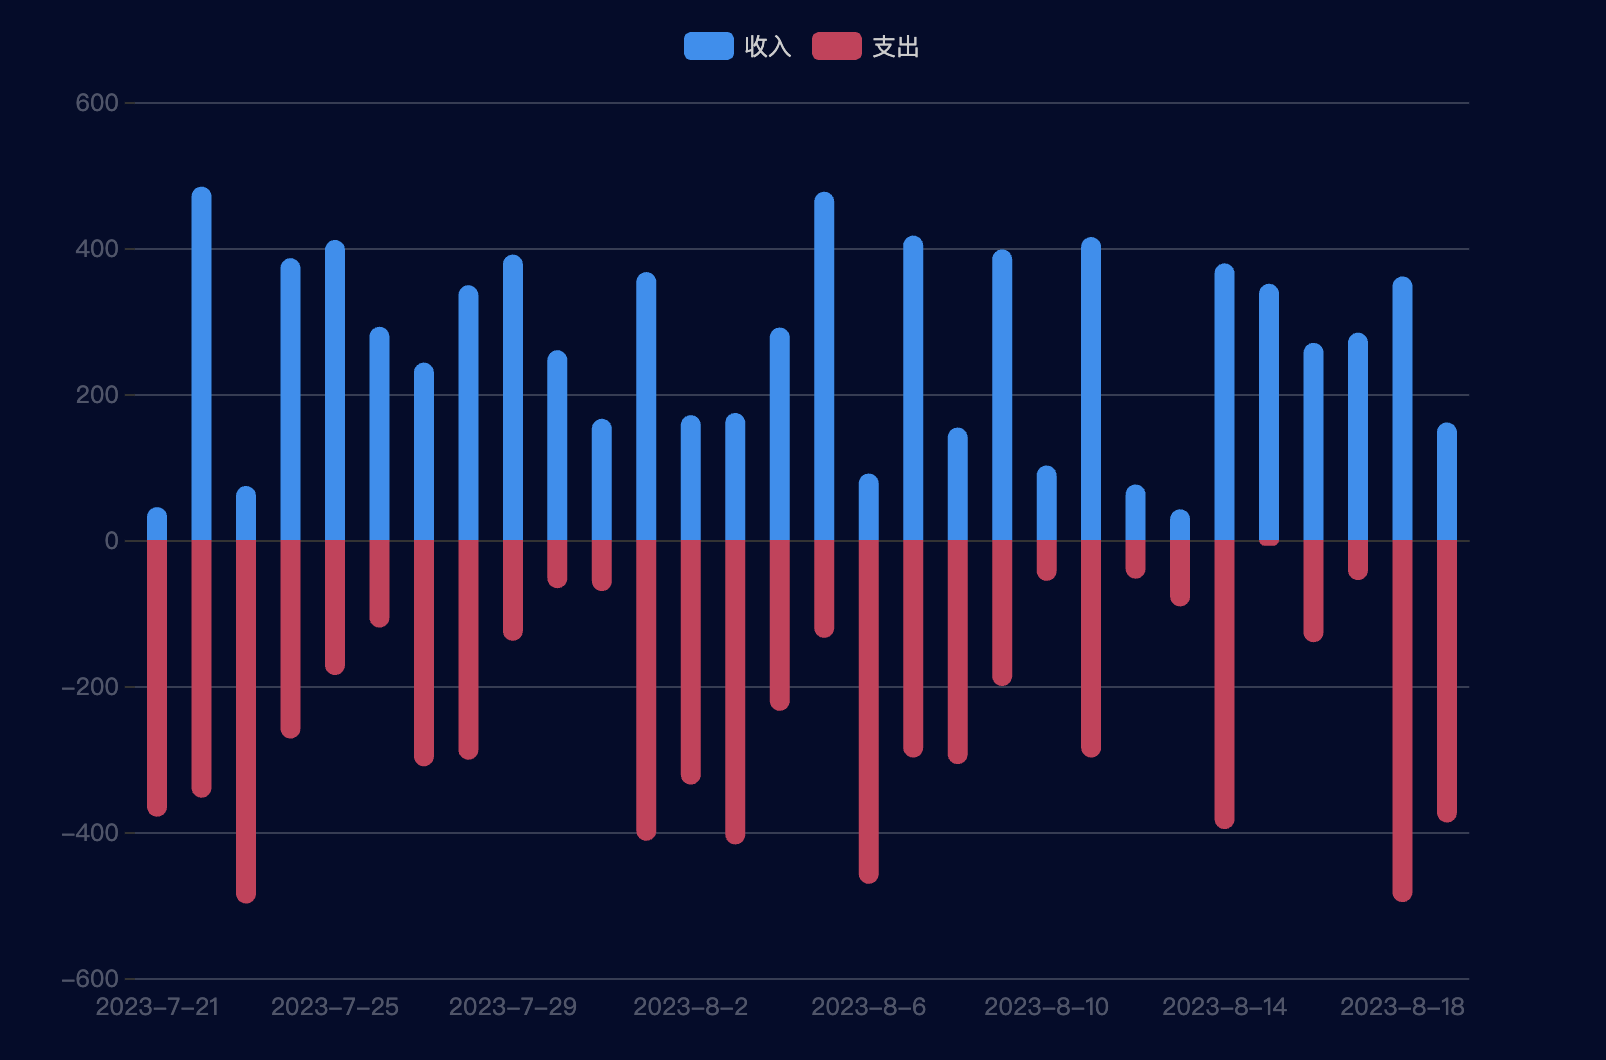
legend: {
data: ['收入','支出'],
y: 20,
textStyle: {
color: '#ccc'
}
},
xAxis: {
type: 'category',
data: category,
axisTick: {
alignWithLabel: true
},
splitLine: {
show: false,
},
axisLabel:{
//fontWeight:10,
//interval:2,
fontsize:2,
align:'center',
color:'rgba(255,255,255,0.3)'
}
},
yAxis: [{
type: 'value',
splitLine: {
show: true,
lineStyle:{
color:'rgba(255,255,255,0.2)'
}
},
axisLine:{
show:false
},
axisLabel:{
fontWeight:10,
fontsize:5,
color:'rgba(255,255,255,0.3)'
}
}],
series: [{
name: '收入',
type: 'bar',
stack: '总量',
barWidth: 10,
itemStyle: {
normal: {
barBorderRadius: [50,50,0,0],
color: new echarts.graphic.LinearGradient(
0, 0, 0, 1,
[
{offset: 0, color: '#0490f2'},
{offset: 1, color: '#0490f2'}
]
)
}
},
data: barData1
},{
name: '支出',
type: 'bar',
stack: '总量',
barWidth: 10,
itemStyle: {
normal: {
barBorderRadius: [0,0,50,50],
color: new echarts.graphic.LinearGradient(
0, 0, 0, 1,
[
{offset: 0, color: '#d03559'},
{offset: 1, color: '#d03559'}
]
)
}
},
data: barData2
}]
};
点击运行 》