const ctx = document.getElementById('myChart');
const data = {
labels: [
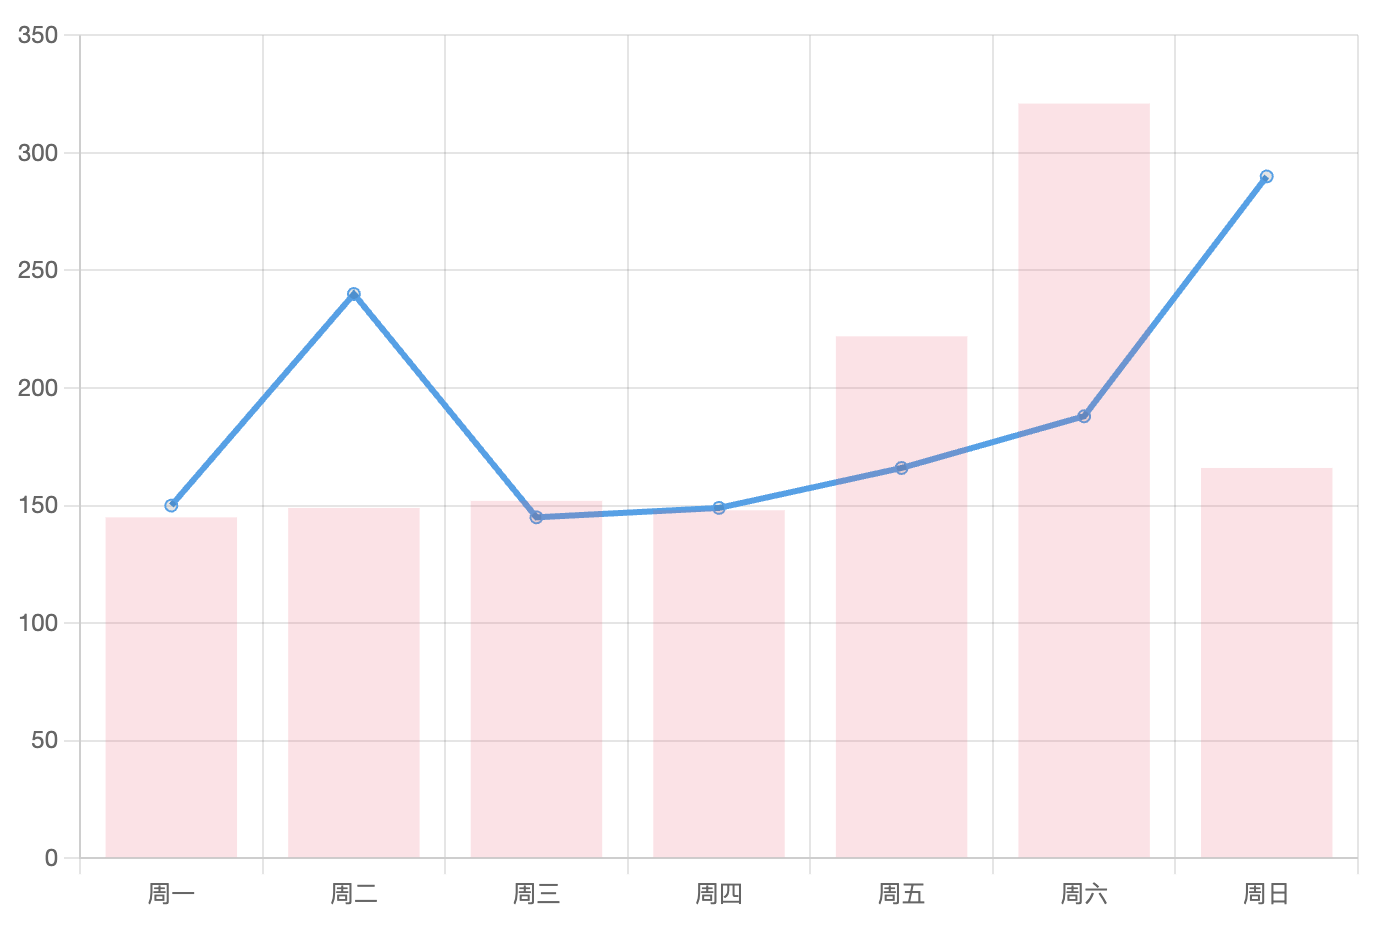
'周一',
'周二',
'周三',
'周四',
'周五',
'周六',
'周日'
],
datasets: [{
type: 'bar',
label: '柱形图',
data: [145, 149, 152, 148, 222, 321, 166],
borderColor: 'rgb(255, 99, 132)',
backgroundColor: 'rgba(255, 99, 132, 0.2)'
}, {
type: 'line',
label: '折线图',
data: [150, 240, 145, 149, 166, 188, 290],
fill: false,
borderColor: 'rgb(54, 162, 235)'
}]
};
const config = {
type: 'scatter',
data: data,
options: {
responsive: true, // 设置图表为响应式,根据屏幕窗口变化而变化
maintainAspectRatio: false,// 保持图表原有比例
scales: {
y: {
beginAtZero: true
}
},
plugins: {
legend: { //隐藏标题栏
display: false
}
}
}
};
const myChart = new Chart(ctx, config);
点击运行 》