const ctx = document.getElementById('myChart');
const data = {
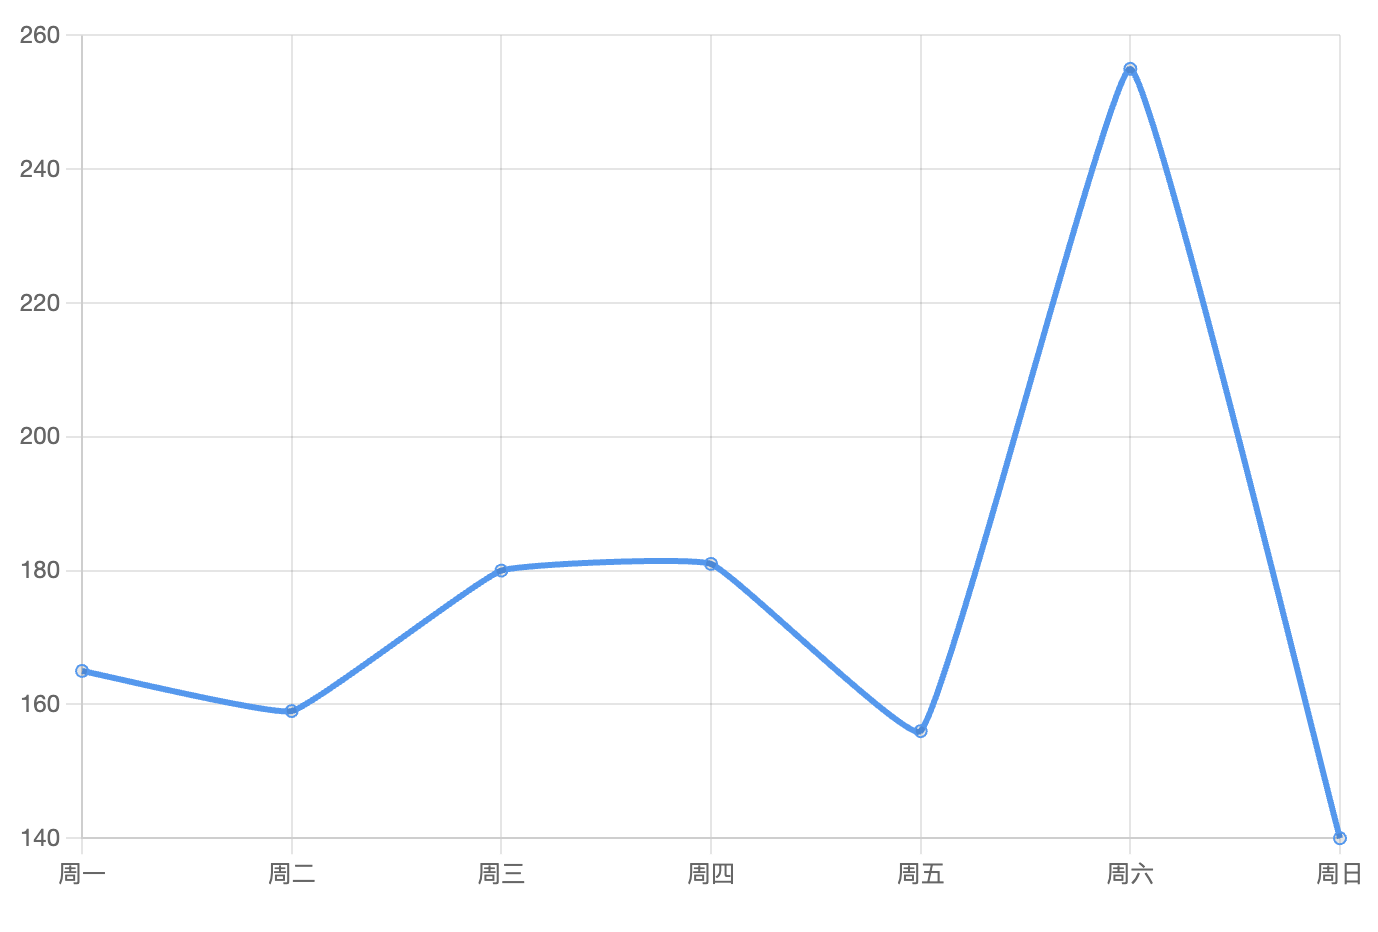
labels: ['周一', '周二', '周三','周四', '周五', '周六', '周日'],
datasets: [{
label: '折线图',
data: [165, 159, 180, 181, 156, 255, 140],
fill: false,
borderColor: '#389af4', // 设置线的颜色
tension: 0.1
}]
};
const config = {
type: 'line', // 设置图表类型
data: data,
options: {
plugins: {
legend: {
display: false
}
}
},
};
const myChart = new Chart(ctx, config);