// value值
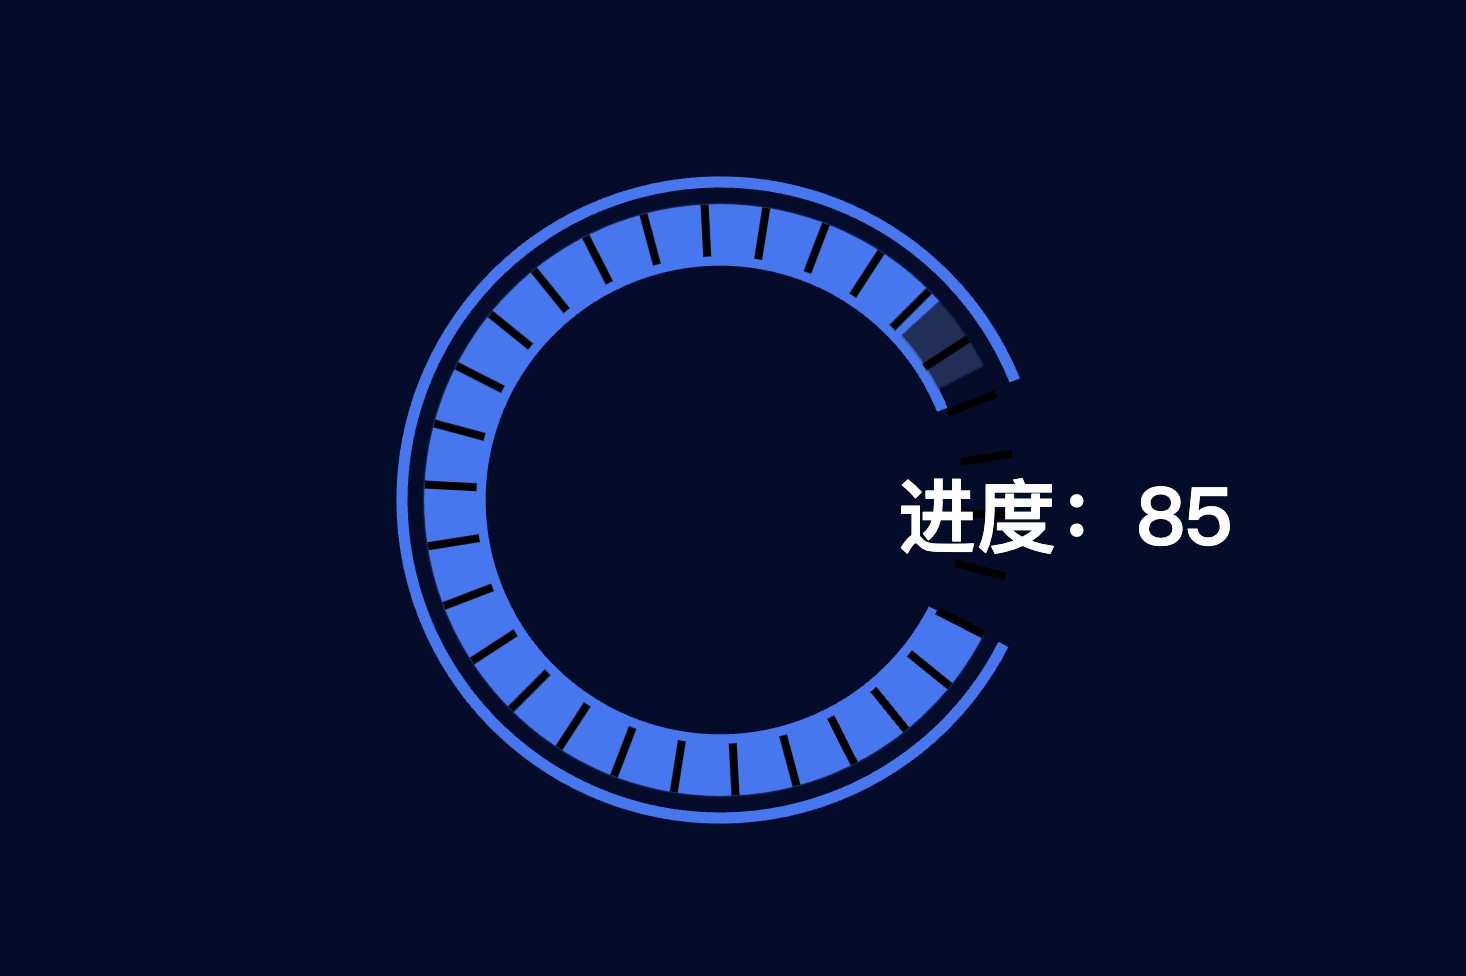
let num=85;
// 通过值控制圆环缺口
let arr=[95,15];
// 圆环起始角度
let startAngle=-((arr[1]/100)*360)/2;
let radius=["42%", "44%"];
let radius2=["56%", "58%"];
let radius3='53%';
option = {
backgroundColor:'#030c2b',
title:{
text:'进度:'+num ,
textStyle:{
color:'#fff',
fontSize:40
},
top:'47%',
left:'60%'
},
polar: [
{
radius: ["33.5%", "63%"],
center: ["50%", "50%"],
},
],
angleAxis: {
max: 100,
show: false,
inverse: false,
},
radiusAxis: {
type: "category",
show: true,
axisLabel: {
show: false,
},
axisLine: {
show: false,
},
axisTick: {
show: false,
},
},
series: [
//极坐标柱状图
{
type: "pie",
zlevel: 0,
silent: true,
startAngle: startAngle,
radius: radius,
z: 1,
label: {
normal: {
show: false,
},
},
labelLine: {
normal: {
show: false,
},
},
itemStyle: {
color: (params) => {
if (params.data == 15) {
return "transparent";
} else {
return '#3579f6';
}
},
},
data: arr,
},
{
type: "pie",
zlevel: 0,
silent: true,
startAngle: startAngle,
radius: radius2,
z: 1,
label: {
normal: {
show: false,
},
},
labelLine: {
normal: {
show: false,
},
},
itemStyle: {
color: (params) => {
if (params.data == 15) {
return "transparent";
} else {
return '#3579f6';
}
},
},
data: arr,
},
//分割刻度
{
type: "gauge",
radius: radius3,
clockwise: false,
startAngle: startAngle,
endAngle: 360+startAngle-0.000001,
splitNumber: 30,
detail: {
offsetCenter: [0, 0],
formatter: " ",
},
pointer: {
show: false,
},
axisLine: {
show: true,
lineStyle: {
color: [
[0, "#fff"],
[-startAngle / 180, "transparent"],
[(100/(arr[0]/100) - num) / (100/(arr[0]/100)), "rgba(53,53,53,.3)"],
[1, "#3579f6"],
],
width: 26,
shadowColor: "#3579f6",
shadowBlur: 1,
},
},
axisTick: {
show: false,
},
splitLine: {
show: true,
length: 26,
distance:-26,
lineStyle: {
color: "rgba(0,0,0,1)",
width: 4,
},
},
axisLabel: {
show: false,
},
},
],
};
点击运行 》