var myChart = document.getElementById('pie');
var option = {
title: {
text: '- CPU状态',
textStyle: {
color: 'rgba(255,255,255,.65)',
fontSize: 16,
fontWeight: 100,
fontFamily: 'Gotham-Book'
}
},
series: [{
type: 'gauge',
progress: {
show: true,
width: 18
},
itemStyle: { //渐变颜色
color: new echarts.graphic.LinearGradient(1, 1, 0, 1, [{
offset: 1,
color: '#0f122e'
}, {
offset: 0,
color: '#a30052'
}])
},
axisLine: {
lineStyle: {
width: 18,
color: [
[1, new echarts.graphic.LinearGradient(0, 0, 1, 0, [{
offset: 0.1,
color: "#242a5d"
},
{
offset: 1,
color: "#242a5d"
}
])]
]
},
},
axisTick: showFalse,
splitLine: {
distance: 5,
length: 3,
lineStyle: {
width: 3,
color: '#242a5d'
},
},
axisLabel: { //是否显示数字
show: false
},
pointer: {
show: false
},
detail: {
valueAnimation: true,
fontSize: 35,
offsetCenter: [0, '10%'],
color: '#fff'
},
title: {
offsetCenter: [0, '100%'],
fontSize: 13,
color: 'rgba(255,255,255,.65)'
},
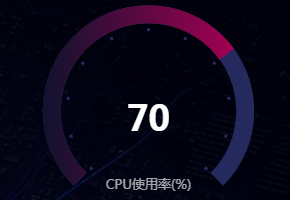
data: [{
value: 70,
name: 'CPU使用率(%)'
}]
}]
};
cpuData = echarts.init(myChart);
cpuData.setOption(option);
window.addEventListener("resize", function() {
cpuData.resize();
})