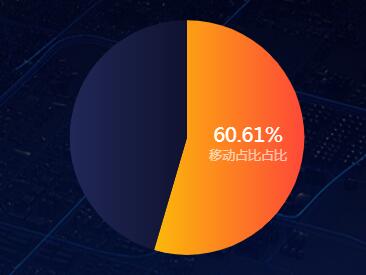
function pieWap(id, title, piesData) {
	var myindex = 0
	var colorArr = [{
		c1: '#fe4838',
		c2: '#fcb90a'
	}, {
		c1: '#0f122f',
		c2: '#212757'
	}]
	var mycolor = ['#feb438', '#671acd']
	var myChart = document.getElementById(id);
	var option = {
		color: mycolor,
		title: {
			text: title,
			textStyle: {
				color: 'rgba(255,255,255,.65)',
				fontSize: 16,
				fontWeight: 100,
				fontFamily: 'Gotham-Book'
			}
		},
		series: {
			name: '移动占比',
			type: 'pie',
			silent: true,
			avoidLabelOverlap: false,
			minAngle: 15, //最小角度
			zlevel: 1,
			itemStyle: {
				normal: {
					color: function(params) {
						let colorList = colorArr
						return new echarts.graphic.LinearGradient(1, 0, 0, 0,
					[{ //颜色渐变函数 前四个参数分别表示四个位置依次为左、下、右、上
							offset: 0,
							color: colorList[params.dataIndex].c1
						}, {
							offset: 1,
							color: colorList[params.dataIndex].c2
						}])
					}

				},
			},
			label: {
				normal: {
					show: true,
					position: 'inner',
					formatter: function(params) {
						if (params.name != '全部') {
							return '{a|' + (params.data.value / 990 *100).toFixed(2) + '%}\n{b|' + params.data.name + "占比}";
						} else {
							return ''
						}
					},
					rich: {
						a: {
							color:'#fff',
							fontSize:20
						},
						b: {
							color: 'rgba(255,255,255,.65)',
							fontSize:13
						},
					},
					lineHeight: 20,
					color: '#fff'
				},
			},
			labelLine: {
				normal: {
					show: false
				}
			},
			data: piesData,
		}
	};

	function drawPie(pieData) {
		pieData = echarts.init(myChart);
		pieData.setOption(option);
		window.addEventListener("resize", function() {
			pieData.resize();
		})
	}
	drawPie('pieData')
}

//数据
var pieWapData = [{
	name: '移动占比',
	value: 600
}, {
	name: '全部',
	value: 500
}]
pieWap("pie3", '- 移动占比', pieWapData)

