let option = {
  backgroundColor: "#030c2b",
  tooltip: {
    show: true,
    trigger: "axis",
    transitionDuration: 0,
    axisPointer: {
  	lineStyle: {
  	  color: "#ffcb00",
  	},
    }
  },
  legend: {
    textStyle: {
  	  fontSize: 12,
  	  color: "rgba(255, 255, 255, 0.8)",
    },
    icon: 'roundRect',
    itemWidth: 18,
    itemHeight: 12,
    top: "2%",
    right: "2%",
  },
  grid: {
    bottom: '10%',
    left: '10%',
    right: '4%',
    top: '20%'
  },
  xAxis: {
    axisLine: {
  	  show: false,
  	  lineStyle: {
  	    color: "#15faff",
  	  },
    },
    axisTick: {
  	  show: false,
    },
    axisLabel: {
  	  show: true,
  	  textStyle: {
  	    //改变刻度字体样式
  	    color: "rgba(255, 255, 255, 0.8)",
  	    fontSize: 13
  	  },
    },
    data: [
	  "08:10",
      "08:20",
      "08:30",
      "08:40",
      "08:50",
      "09:10",
      "09:20",
      "09:30",
      "09:40",
      "09:50",
      "10:00",
      "10:10",
      "10:20",
      "10:30",
      "10:40",
      "10:50",
      "11:00",
      "11:10",
      "11:20",
      "11:30",
      "11:40",
      "11:50",
      "12:00",
      "13:00"
	],
  },
  yAxis: {
    axisLine: {
  	  show: true,
  	  lineStyle: {
  	    color: "#274452",
  	  }
    },
    axisTick: {
  	  show: false,
  	  alignWithLabel: true
    },
    splitLine: {
  	  lineStyle: {
  	    type: "dashed",
  	    color: "#293a4c",
  	  },
    },
    axisLabel: {
  	  textStyle: {
  	    //改变刻度字体样式
  	    color: "rgba(255, 255, 255, 0.8)",
  	    fontSize: 13
  	  },
    },
  },
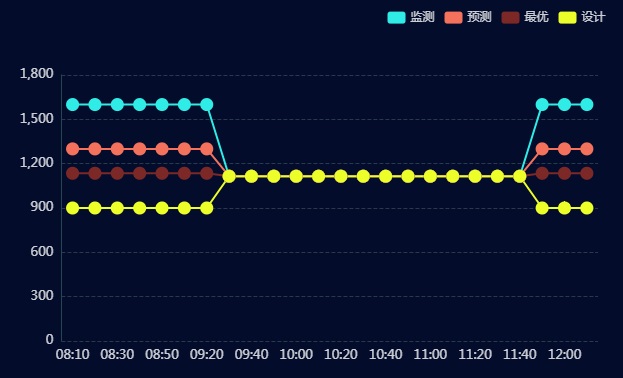
  series: [
    {
  	  name: "监测",
  	  type: "line",
  	  symbol: "circle",
  	  symbolSize: 13,
  	  itemStyle: {
  	    color: "#2fece6",
  	  },
  	  data: [1600, 1600, 1600, 1600, 1600, 1600, 1600, 1115, 1115,1115,1115,1115,1115,1115,1115,1115,1115,1115,1115,1115,1115,1600,1600,1600]
    },
    {
  	  name: "预测",
  	  type: "line",
  	  symbol: "circle",
  	  symbolSize: 13,
  	  itemStyle: {
  	    color: "#f4715c",
  	  },
  	  data: [1300, 1300, 1300, 1300, 1300, 1300, 1300, 1115, 1115,1115,1115,1115,1115,1115,1115,1115,1115,1115,1115,1115,1115,1300,1300,1300]
    },
    {
  	  name: "最优",
  	  type: "line",
  	  symbol: "circle",
  	  symbolSize: 13,
  	  itemStyle: {
  	    color: "#7c2826",
  	  },
  	  data: [1135, 1135, 1135, 1135, 1135, 1135, 1135, 1115, 1115,1115,1115,1115,1115,1115,1115,1115,1115,1115,1115,1115,1115,1135,1135,1135]
    },
    {
  	  name: "设计",
  	  type: "line",
  	  symbol: "circle",
  	  symbolSize: 13,
  	  itemStyle: {
  	    color: "#ecff29",
  	  },
  	  data: [900, 900, 900, 900, 900, 900, 900, 1115, 1115,1115,1115,1115,1115,1115,1115,1115,1115,1115,1115,1115,1115,900,900,900]
    }
  ]
};
var myChart = echarts.init(document.getElementById('main'));
myChart.setOption(option);
点击运行 》

