var option = {
tooltip: {
show: true,
trigger: 'axis',
transitionDuration: 0, // 让toolltip紧跟鼠标
axisPointer: {
type: 'cross',
label: {
backgroundColor: '#6a7985'
}
}
},
legend: {
show: false,
textStyle: {
color: '#fff',
fontSize: 13
}
},
grid: {
left: '2%',
right: '5%',
bottom: '6%',
containLabel: true
},
xAxis: [
{
type: 'category',
boundaryGap: false,
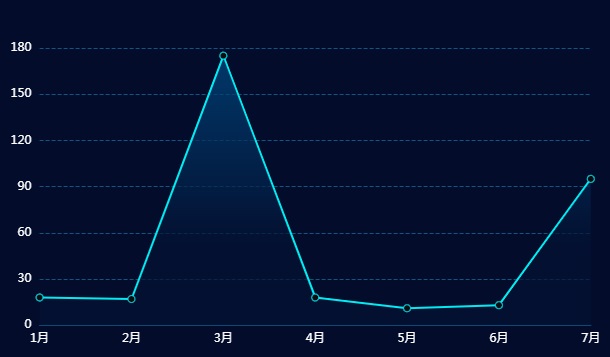
data: ['1月', '2月', '3月', '4月', '5月', '6月', '7月'],
axisTick: {
show:false,
alignWithLabel: true
},
axisLine: {
lineStyle: {
color: '#0f5681'
}
},
splitLine: {
show: false,
lineStyle: {
color: '#0f5681',
type: 'dotted'
},
},
axisLabel: {
show: true,
textStyle: {
color: '#fff', //更改坐标轴文字颜色
fontSize: 12 //更改坐标轴文字大小
}
}
},
],
yAxis: {
type: 'value',
name: this.yUnit,
nameTextStyle: {
color:'#fff',
fontSize:12,
align:'right'
},
axisLine: {
lineStyle: {
color: '#0f5681'
}
},
axisTick: {
show:false,
alignWithLabel: true
},
splitLine: {
lineStyle: {
color: '#0f5681',
type: 'dashed' // solid dashed dotted
},
},
axisLabel: {
show: true,
align:'right',
textStyle: {
color: '#fff', //更改坐标轴文字颜色
fontSize: 12 //更改坐标轴文字大小
}
},
},
series: [
{
name: this.name,
type: 'line',
symbol: 'circle',
symbolSize: '0.7',
itemStyle: {
// 线和拐点的颜色
borderColor: '#01ecf2',
color: '#0e0b12', //图例的颜色
},
emphasis: {
itemStyle: { // 移入拐点样式配置
color: '#0e0b12', //图例的颜色
borderColor: '#b08010', //图形的描边颜色
}
},
areaStyle: {
color: new echarts.graphic.LinearGradient(0, 0, 0, 1, [
{ offset: 0, color: "#004b85" },
{ offset: 0.7, color: "#031233" },
{ offset: 1, color: "#031233" },
])
},
lineStyle: {
color:'#01ecf2'
},
data: [18, 17, 175, 18, 11, 13, 95]
}
]
};
var myChart = echarts.init(document.getElementById('main'));
myChart.setOption(option);
点击运行 》