var option = {
grid: {
top: '18%',
left: '2%',
right: '2%',
bottom: '3%',
containLabel: true
},
legend: {
x: "40%",
y: "0%",
orient: "horizontal",
textStyle: {
color: function (data) {
const value = data.data;
if (value > 60) {
return "#FF1700";
}
if (value > 30 && value < 60) { return "#F69729"; } if (value > 10 && value < 20) {
return "#E6CA40";
}
if (value < 10) {
return "#00BBE6";
}
}
}
},
xAxis: {
type: "category",
name: "",
nameTextStyle: {
padding: [-550, 0, 0, -55],
color: "#5FDAFC",
},
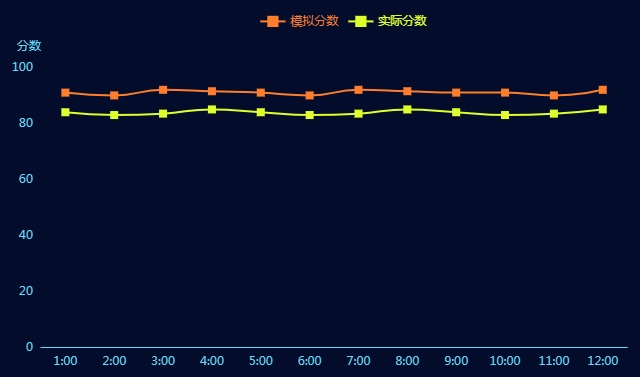
data: [ '1:00', '2:00', '3:00', '4:00', '5:00', '6:00', '7:00', '8:00', '9:00', '10:00', '11:00', '12:00'],
axisLine: {
lineStyle: {
color: "#5FDAFC",
},
},
axisTick: {
show: false,
},
splitLine: {
show: false,
lineStyle: {
color: ["red"], // 使用深浅的间隔色
}
}
},
yAxis: {
type: "value",
name: "分数",
nameTextStyle: {
padding: [0, 0, 0, 30],
color: "#5FDAFC",
align: 'right'
},
axisTick: {
show: false,
},
axisLine: {
lineStyle: {
color: "#5FDAFC",
},
},
splitLine: {
show: false,
lineStyle: {
color: ["red"],
}
}
},
emphasis: {
label: {
show: true,
},
},
series: [
{
name: "模拟分数",
data: [91, 90, 92, 91.5, 91, 90, 92, 91.5, 91, 91, 90, 92],
type: "line",
symbol: "square",
symbolSize: 8,
smooth: true,
itemStyle: {
normal: {
color: "#FF7E2C",
lineStyle: {
color: "#FF7E2C",
}
}
}
},
{
name: "实际分数",
data: [84, 83, 83.5, 85, 84, 83, 83.5, 85, 84, 83, 83.5, 85],
type: "line",
symbol: "square",
symbolSize: 8,
smooth: true,
itemStyle: {
normal: {
color: "#DFFF2C",
lineStyle: {
color: "#DFFF2C",
}
}
}
}
]
}
var myChart = echarts.init(document.getElementById('main'));
myChart.setOption(option);
点击运行 》