//数字转换
function numerbConvert(value, index) {
if (value >= 100000000) {
return value / 100000000 + "亿";
} else if (value >= 10000000) {
return value / 10000000 + "千万";
} else if (value >= 1000000) {
return value / 1000000 + "百万";
} else if (value >= 10000) {
return value / 10000 + "万";
} else {
return value;
}
}
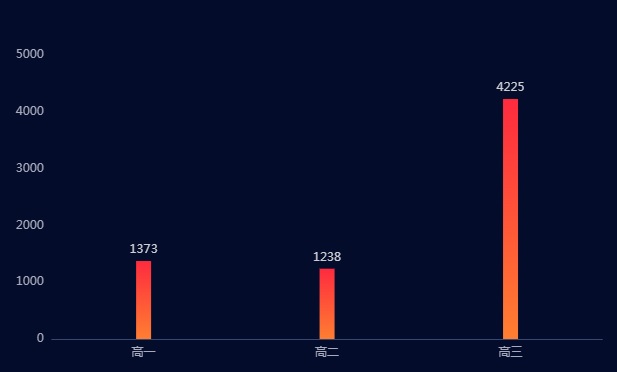
var categories = ["高一", "高二", "高三"]
var seriesData = [{
name: "高一",
value: 1373,
children: [{
appointmentType: "语文",
checkNum: 95,
percentage: "32.00%",
color: "#03d3c4"
},
{
appointmentType: "数学",
checkNum: 120,
percentage: "35.00%",
color: "#ffbb32"
},
{
appointmentType: "英语",
checkNum: 125,
percentage: "32.00%",
color: "#2ccd45"
}
]
}, {
name: "高二",
value: 1238,
children: [{
appointmentType: "语文",
checkNum: 95,
percentage: "32.00%",
color: "#03d3c4"
},
{
appointmentType: "数学",
checkNum: 120,
percentage: "35.00%",
color: "#ffbb32"
},
{
appointmentType: "英语",
checkNum: 125,
percentage: "32.00%",
color: "#2ccd45"
}
]
}, {
name: "高三",
value: 4225,
children: [{
appointmentType: "语文",
checkNum: 95,
percentage: "32.00%",
color: "#03d3c4"
},
{
appointmentType: "数学",
checkNum: 120,
percentage: "35.00%",
color: "#ffbb32"
},
{
appointmentType: "英语",
checkNum: 125,
percentage: "32.00%",
color: "#2ccd45"
}
]
}]
var barCharts = {
title: {
text: '2023年学校成绩表',
textStyle: {
color: '#fff',
fontSize: 16,
fontWeight: 100
}
},
tooltip: {
trigger: 'axis',
axisPointer: {
type: 'line',
lineStyle: {
color: '#fff',
width: 1,
type: 'dashed'
}
},
formatter: function(params) {
let _res = params[0].data.children
let _list = ''
for (let i = 0; i < _res.length; i++) {
_list += '' + _res[i].appointmentType +
'' + _res[i].checkNum + '/' + _res[i].percentage +
'
'
}
return params[0].name + '各科成绩
' + _list
}
},
grid: {
left: '1%',
right: '3%',
top: '24%',
bottom: '5%',
containLabel: true
},
xAxis: {
type: 'category',
data: categories,
splitLine: {
show: false
},
axisTick: {
show: false
},
axisLabel: {
textStyle: {
color: '#a8abbb',
fontSize: 12
}
},
axisLine: {
lineStyle: {
color: '#394773'
}
}
},
yAxis: {
type: 'value',
splitLine: {
show: false
},
axisTick: {
show: false
},
axisLabel: {
formatter: numerbConvert,
textStyle: {
color: '#a8abbb',
fontSize: 12
}
},
axisLine: {
lineStyle: {
color: '#394773'
}
}
},
series: [{
name: '成绩',
type: 'bar',
barWidth: '15',
data: seriesData,
itemStyle: {
normal: {
label: {
show: true,
position: 'top',
textStyle: {
color: '#ceced3',
fontSize: 12
}
},
color: function(params) {
return new echarts.graphic.LinearGradient(0, 0, 0, 1, [{
offset: 0,
color: '#FE2B3E'
}, {
offset: 1,
color: '#FF7E31'
}])
}
}
}
}],
barCategoryGap: '40%'
};
var myChart = echarts.init(document.getElementById('main'));
myChart.setOption(option);
点击运行 》