const ctx = document.getElementById('myChart');
const data = {
datasets: [{
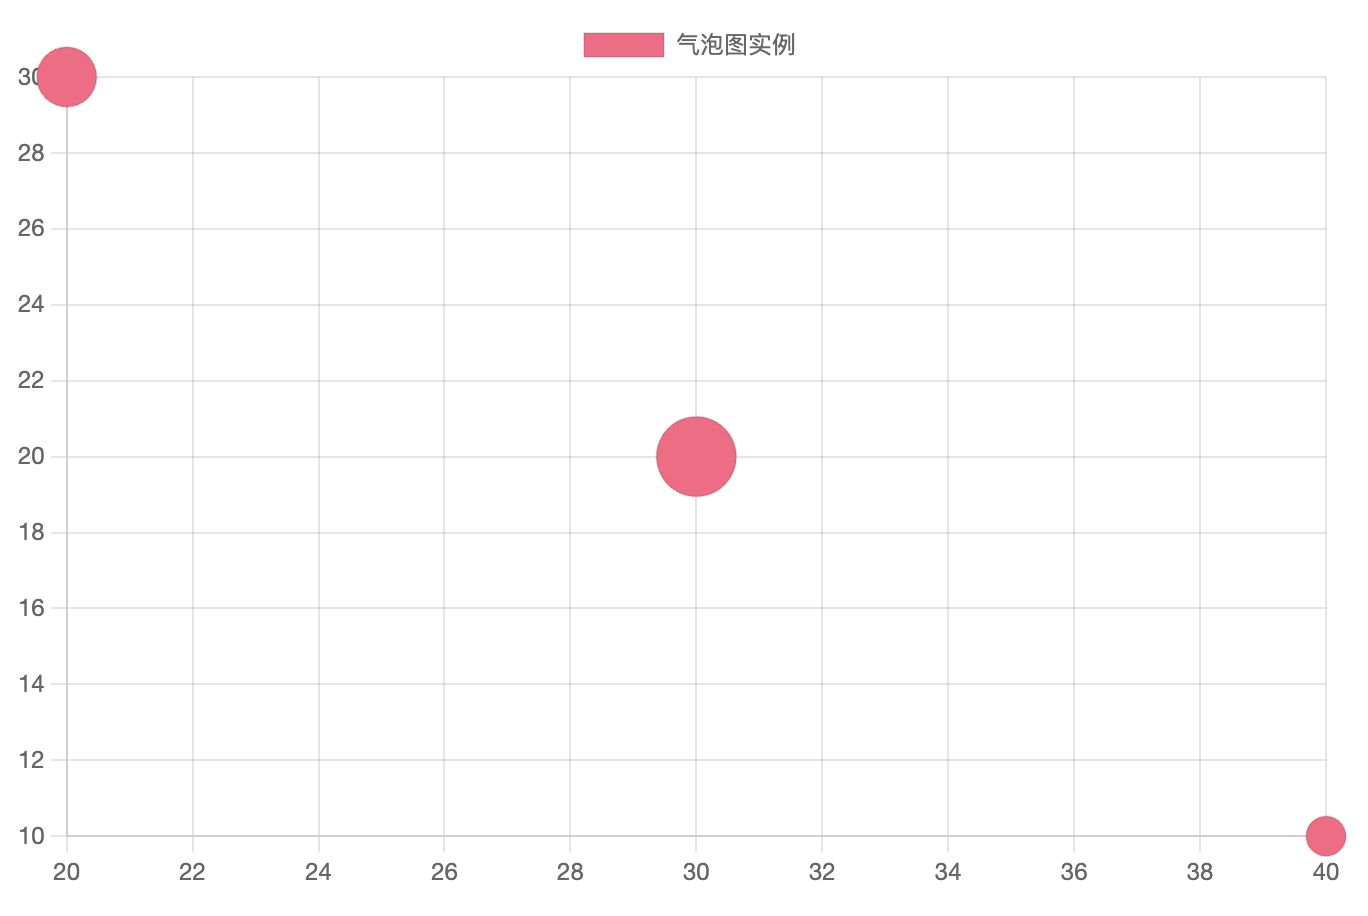
label: '气泡图实例',
data: [{
x: 20, // X 轴
y: 30, // Y 轴
r: 15 // 气泡半径
}, {
x: 30,
y: 20,
r: 20
}, {
x: 40,
y: 10,
r: 10
}],
backgroundColor: 'rgb(255, 99, 132)'
}]
};
const config = {
type: 'bubble', // 设置图表类型
data: data, // 设置数据集
options: {
},
};
const myChart = new Chart(ctx, config);