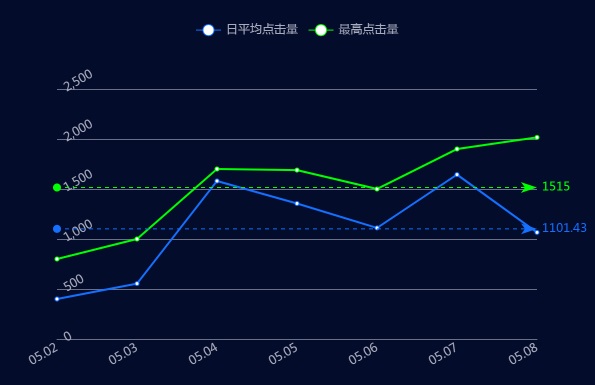
var myChart = echarts.init(document.getElementById('main'));
option = {
  backgroundColor: '#030c2b',
  color: ["#156fff"],
  legend: {
    y: '20',
    data:['日平均点击量','最高点击量'],
	textStyle: {
	  color: '#a8abbb',
	  fontSize: 12
    }
  },
  grid:{
    left:'10%',
    top:90,
    right:'10%',
    bottom:'15%',
  },
  xAxis:  {
    type: 'category',
    axisLabel: {//横坐标的控制
	  show:true,//是否显示横坐标数据
	  rotate: 30,//坐标的倾斜角度
	  inside:false,//刻度是否朝内
	  margin:8,//标尺与轴线的距离,默认8
	  textStyle: {
        color: '#a8abbb',
        fontSize: 12
      }
    },
	splitLine: {
      show: false
    },
    axisTick: {
      show: false
    },
    axisLine: {
      lineStyle: {
        color: '#6c7087'
      }
    },
    boundaryGap: false,
    data: ['05.02','05.03','05.04','05.05','05.06','05.07','05.08']
  },
  yAxis: {  //设置纵坐标
    type: 'value',
    axisLabel: {
	  formatter: '{value}',
	  rotate: 30,//坐标的倾斜角度
	  inside:true,//刻度是否朝内
	  textStyle: {
        color: '#a8abbb',
        fontSize: 12
      }
    },
	 axisTick:  {
      show: false
    },
    axisLine:  {
      show: false
    },
    splitLine: {
      lineStyle: {
        color: '#6c7087'
      }
    }
  },
  series: [
    {
	  name:'日平均点击量',
	  type:'line',
	  data:[400, 554, 1580, 1355, 1111, 1644, 1066],
	  markLine: {
		data: [
		{type: 'average', name: '平均值'}
		]
	  }
    },
    {
	  name:'最高点击量',
	  type:'line',
	  data:[800, 1000, 1700, 1689, 1500, 1900, 2016],
	  markPoint: {
		data: [
			{name: '周最低', value: -2, xAxis: 1, yAxis: -1.5}
		]
	  },
	  markLine: {
		data: [
		  {type: 'average', name: '平均值'},
		  [{
		    symbol: 'none',
		    x: '90%',
		    yAxis: 'max'
		  }, {
		    symbol: 'circle',
		  }]
		]
	  },
   itemStyle: {
     normal: {
       color: '#00FF00',//改变折线点的颜色
       lineStyle: { //改变折线颜色
        color: '#00FF00'
       }
     }
   },
    }
  ]
};
myChart.setOption(option);
点击运行 》

