var myChart = echarts.init(document.getElementById('main'));
option = {
backgroundColor: '#030c2b',
series: [
{
name: '树图',
type: 'tree',
orient: 'horizontal', // vertical horizontal
rootLocation: { x: 100, y: 230 }, // 根节点位置 {x: 100, y: 'center'}
nodePadding: 30,
layerPadding: 200,
hoverable: false,
roam: true,
symbolSize: 18,
itemStyle: {
normal: {
color: '#fff',
label: {
show: true,
position: 'right',
formatter: "{b}",
textStyle: {
color: '#fff',
fontSize: 18
}
},
lineStyle: {
color: '#d54cd0',
type: 'curve' // 'curve'|'broken'|'solid'|'dotted'|'dashed'
}
},
emphasis: {
color: '#fff',
label: {
show: false
},
borderWidth: 0
}
},
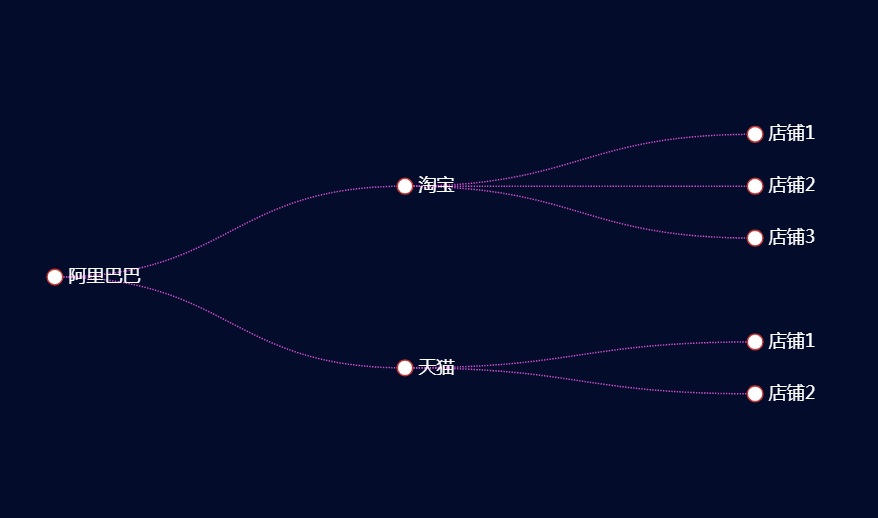
data: [
{ "name": "阿里巴巴", "children": [
{
"name": "淘宝", "children": [{ "name": "店铺1" }, { "name": "店铺2" }, { "name": "店铺3" }]
},
{
"name": "天猫", "children": [{ "name": "店铺1"}, { "name": "店铺2" }]
}
]
}]
}
]
};
myChart.setOption(option);