var myChart = echarts.init(document.getElementById('main'));
var option = {
tooltip: {
trigger: 'axis',
axisPointer: {
type: 'cross',
label: {
backgroundColor: '#6a7985'
}
}
},
legend: {
data: ['柱状图', '折线图']
},
xAxis: {
type: 'category',
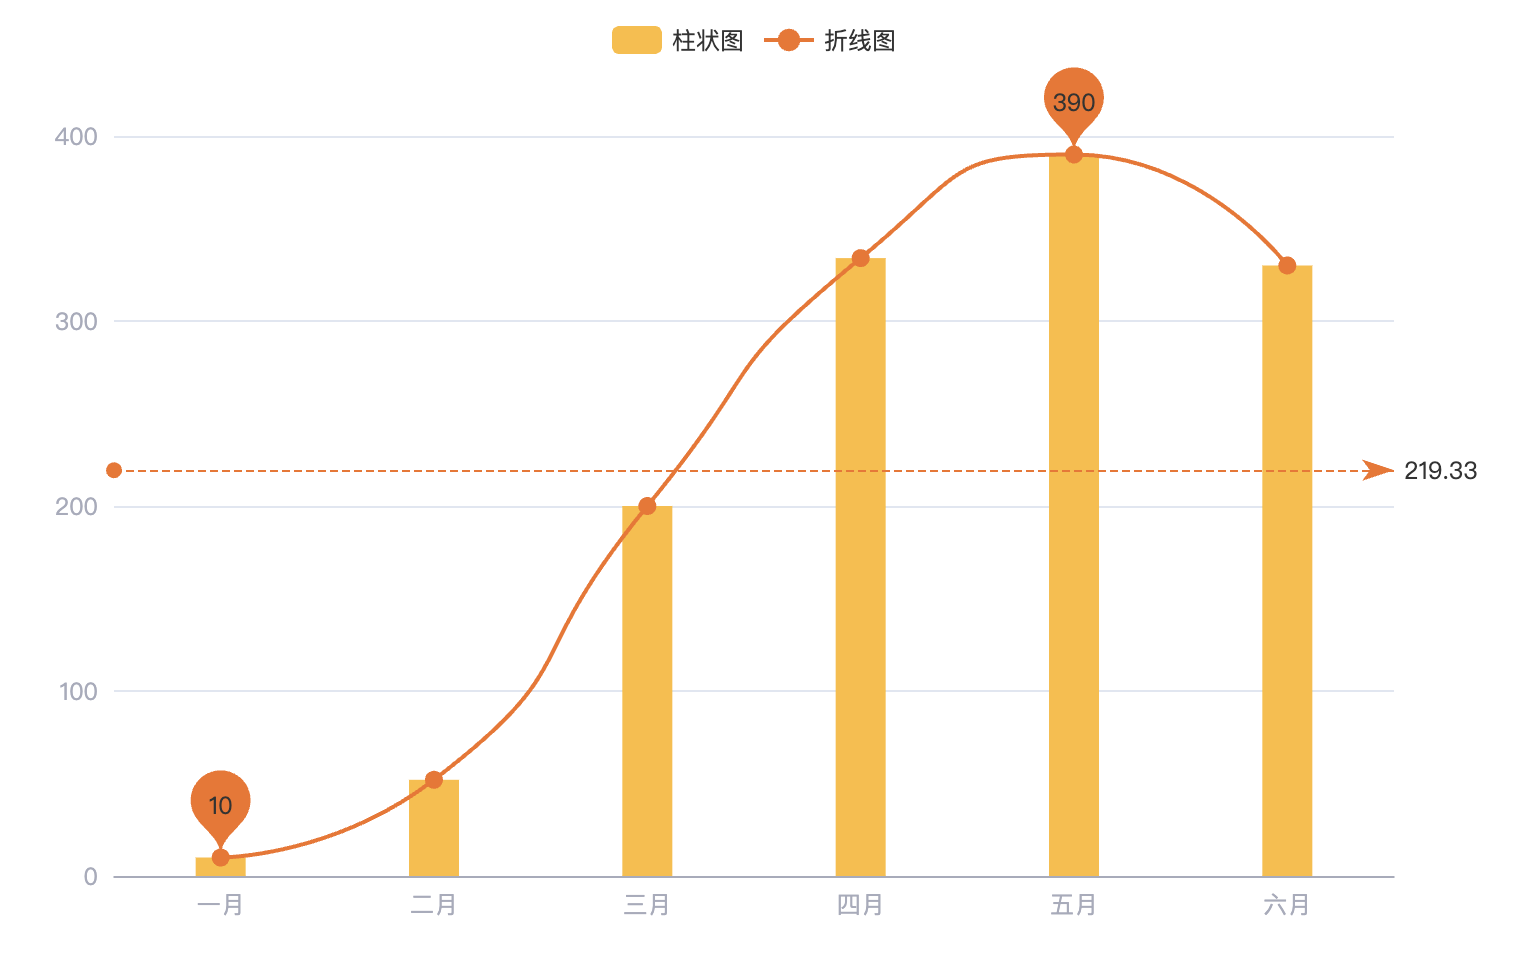
data: ['一月', '二月', '三月', '四月', '五月', '六月'],
axisTick: {
show:false
},
axisLabel: {
textStyle: {
color: '#a8abbb',
fontSize: 12,
fontFamily:'Gotham-Book'
}
},
axisLine: {
lineStyle: {
color: '#a8abbb'
}
},
splitLine: {
lineStyle: {
color: '#a8abbb'
}
},
},
yAxis: {
type: 'value',
axisTick: {
show:false
},
axisLabel: {
textStyle: {
color: '#a8abbb',
fontSize: 12,
fontFamily:'Gotham-Book'
}
},
axisLine: {
lineStyle: {
color: '#a8abbb'
}
}
},
series: [
{
color: '#FFBB32',
name: '柱状图',
type: 'bar',
data: [10, 52, 200, 334, 390, 330],
barWidth: '25',
emphasis: {
focus: 'series'
}
},
{
color: '#F6701F',
name: '折线图',
type: 'line',
data: [10, 52, 200, 334, 390, 330],
showSymbol:true,
smooth: 0.6, //拐点圆形
symbol: "circle", //形状 'circle’, 'rect’, 'roundRect’, 'triangle’, 'diamond’, 'pin’, 'arrow'
symbolSize: 9, //大小
markPoint: {
data: [
{type: 'max', name: '最大值'},
{type: 'min', name: '最小值'}
]
},
markLine: {
data: [
{type: 'average', name: '平均值'}
]
}
}
],
dataZoom: [
{
type: 'inside',
xAxisIndex: 0,
start: 0,
end: 1000
},
{
type: 'inside',
yAxisIndex: 0,
start: 0,
end: 1000
}
],
// 启用数据交互
// 可以用鼠标悬停来显示工具提示,或者用鼠标点击来平铺展示图表细节
// 也可以通过 dataZoom 组件进行滑动缩放操作
interactive: true,
};
// 使用刚指定的配置项和数据显示图表。
myChart.setOption(option);
点击运行 》