option = {
backgroundColor: '#030c2b',
tooltip: {
trigger: 'item',
triggerOn: 'mousemove',
backgroundColor : '#dfdfdf',
textStyle: {
color : 'black'
}
},
series: [{
type: "tree",
symbolSize: 75,
symbol: 'roundRect',
edgeShape: 'polyline',
edgeForkPosition: '50%',
initialTreeDepth: 2,
orient: 'vertical',
itemStyle: {
color: 'black',
borderColor: 'black',
},
expandAndCollapse: true,
animationDuration: 550,
animationDurationUpdate: 750,
lineStyle: {
color: '#7b7b7b',
width: 3
},
label: {
show: true,
position: 'inside',
textStyle: {
fontSize: 15,
color: '#fff',
},
},
leaves: {
label: {
position: 'inside',
color: '#fff'
},
itemStyle: {
color: '#dfdfdf',
borderColor: '#dfdfdf',
}
},
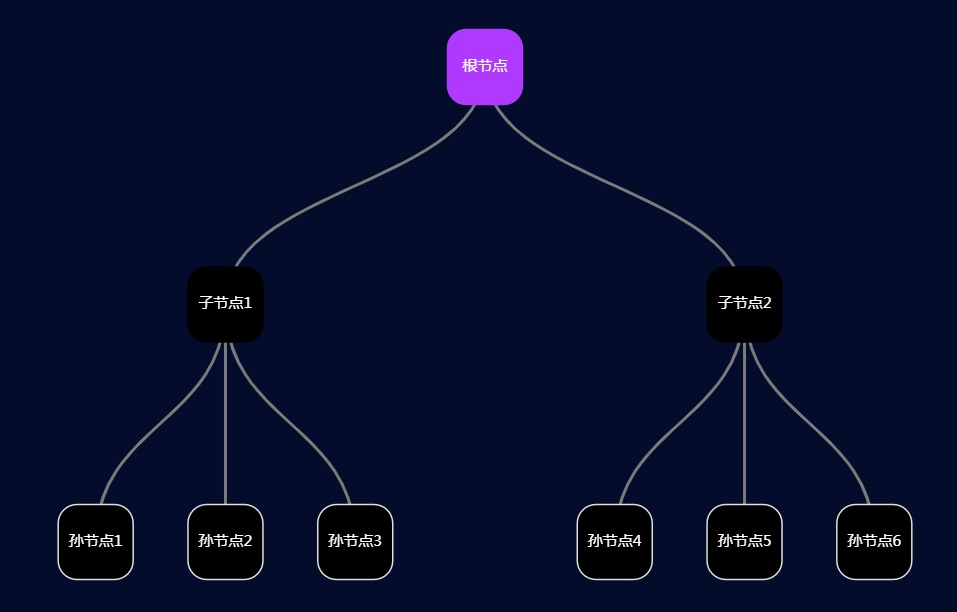
data: [{
name: "根节点",
url: '',
// 根节点样式设置
itemStyle: {
color: '#b039ff',
borderColor: '#b039ff',
},
children: [
{
name: "子节点1",
children: [{
name: "孙节点1"
}, {
name: "孙节点2"
}, {
name: "孙节点3"
}]
}, {
name: "子节点2",
children: [{
name: "孙节点4"
}, {
name: "孙节点5"
}, {
name: "孙节点6"
}]
}]
}],
}]
}
var myChart = echarts.init(document.getElementById('main'));
myChart.setOption(option);
点击运行 》