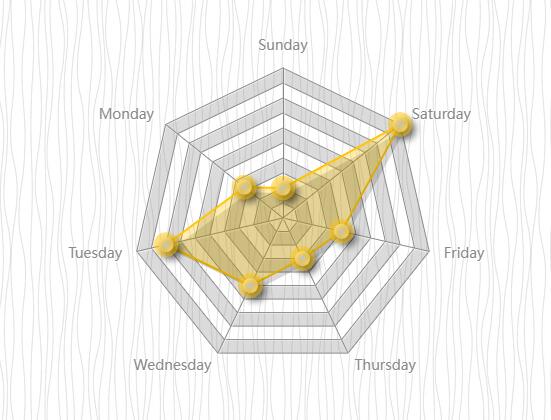
option = {
    radar: {
        radius: '60%',
        center: ['50%', '55%'],
        // startAngle: 0,
        splitNumber: 10,
        nameGap: '15',
        name: {
            textStyle: {
                color: '#898989',
                textShadowColor: '#fff',
                textShadowBlur: '0',
                textShadowOffsetX: 1,
                textShadowOffsetY: 1,
                fontSize: 14,
            }
        },
        axisLine: {
            lineStyle: {
                color: '#898989',
                shadowBlur: 1,
                shadowColor: '#fff',
                shadowOffsetX:.5,
                shadowOffsetY:1,
            }
        },
        splitLine: {
            lineStyle: {
                width: 1,
                color: '#898989',
                shadowColor: '#fff',
                shadowBlur: 0,
                shadowOffsetX: .5,
                shadowOffsetY: .5,
            }
        },
        splitArea: {
            areaStyle: {
                color: ['rgba(137, 137, 137, .3', 'rgba(0, 255, 255, 0', ].reverse(),

            }
        },
        indicator: [{
                name: 'Sunday',
                max: 100
            },
            {
                name: 'Monday',
                max: 100
            },
            {
                name: 'Tuesday',
                max: 100
            },
            {
                name: 'Wednesday',
                max: 100
            },
            {
                name: 'Thursday',
                max: 100
            },
            {
                name: 'Friday',
                max: 100
            },
            {
                name: 'Saturday',
                max: 100
            }
        ]
    },
    series: [{
        name: 'Title',
        type: 'radar',
        symbolSize: 15,
        itemStyle: {
            color: 'rgba(255, 197, 0, 1)',
            borderColor: 'rgba(255, 197, 0, 0.5)',
            borderWidth: 10,
            shadowColor: 'rgba(0, 0, 0, .5)',
            shadowBlur: 5,
            shadowOffsetX: 5,
            shadowOffsetY: 5,
        },
        areaStyle: {
            normal: {
                width: 1,
                opacity: 0.3,
                shadowColor: 'rgba(0, 0, 0, .5)',
                shadowBlur: 0,
                shadowOffsetX: 5,
                shadowOffsetY: 5,
            },
        },
        data: [{
            itemStyle: {
                normal: {
                    color: '#ffc500',
                },
            },
            value: [20, 33, 80, 50, 30, 40, 100]
        }]
    }]
};

radarData = echarts.init(document.getElementById("main"));
radarData.setOption(option);
window.addEventListener("resize", function() {
	radarData.resize();
})
点击运行 》

