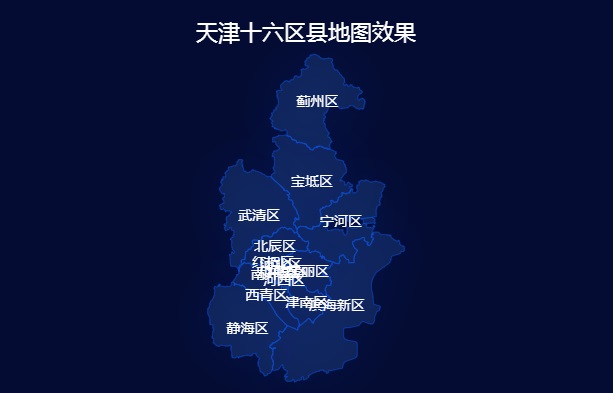
var uploadedDataURL = '/json/天津市/全貌.geojson'
var myChart = echarts.init(document.getElementById('map'));
function cityMap() {
  $.get(uploadedDataURL, function(geoJson) {
    echarts.registerMap('中国各市县形状', geoJson);
    option = {
        backgroundColor: '#040c33',
        title: {
          show: true,
          x: "center",
          y: "20",
          text: "百度Echarts天津十六区县地图效果",
          textStyle: {
            color: "#fff",
            fontSize: 22,
            fontWeight: 'normal'
          }
        },
        "geo": {
          "map": "中国各市县形状",
          "layoutCenter": ["50%", "55%"],
          "layoutSize": "82%",
          "roam": true, //是否允许缩放
          "mapLocation": {
            "width": "100%",
            "height": "85%"
          },
          label: {
            normal: { //静态的时候展示样式
              show: true, //是否显示地图份得名称
              textStyle: {
                color: "#fff",
                fontSize: 14
              }
            },
            emphasis: { //动态展示的样式
              color: '#fff',
            },
          },
          "itemStyle": {
            normal: {
              areaColor: 'rgba(58, 127, 213, .2)',
              borderColor: '#0a53e9', //线
              shadowColor: '#092f8f', //外发光
              shadowBlur: 50
            },
            "emphasis": {
              color: 'rgba(58, 127, 213, 1)' //悬浮背景
            }
          }
        },
      },
      myChart.setOption(option);
      window.addEventListener("resize", function() {
	myChart.resize();
      })
  });
}
cityMap()
点击运行 》

