var colors = ['rgba(251,210,73,0.8)', 'rgba(251,210,73,0.8)', 'rgba(124,213,253,0.8)', 'rgba(124,213,253,0.8)', 'rgba(124,213,253,0.8)', 'rgba(124,213,253,0.8)', 'rgba(124,213,253,0.8)', 'rgba(124,213,253,0.8)', 'rgba(181,236,69,0.8)', 'rgba(181,236,69,0.8)', 'rgba(136,243,227,0.8)', 'rgba(136,243,227,0.8)', 'rgba(136,243,227,0.8)', 'rgba(136,243,227,0.8)'];
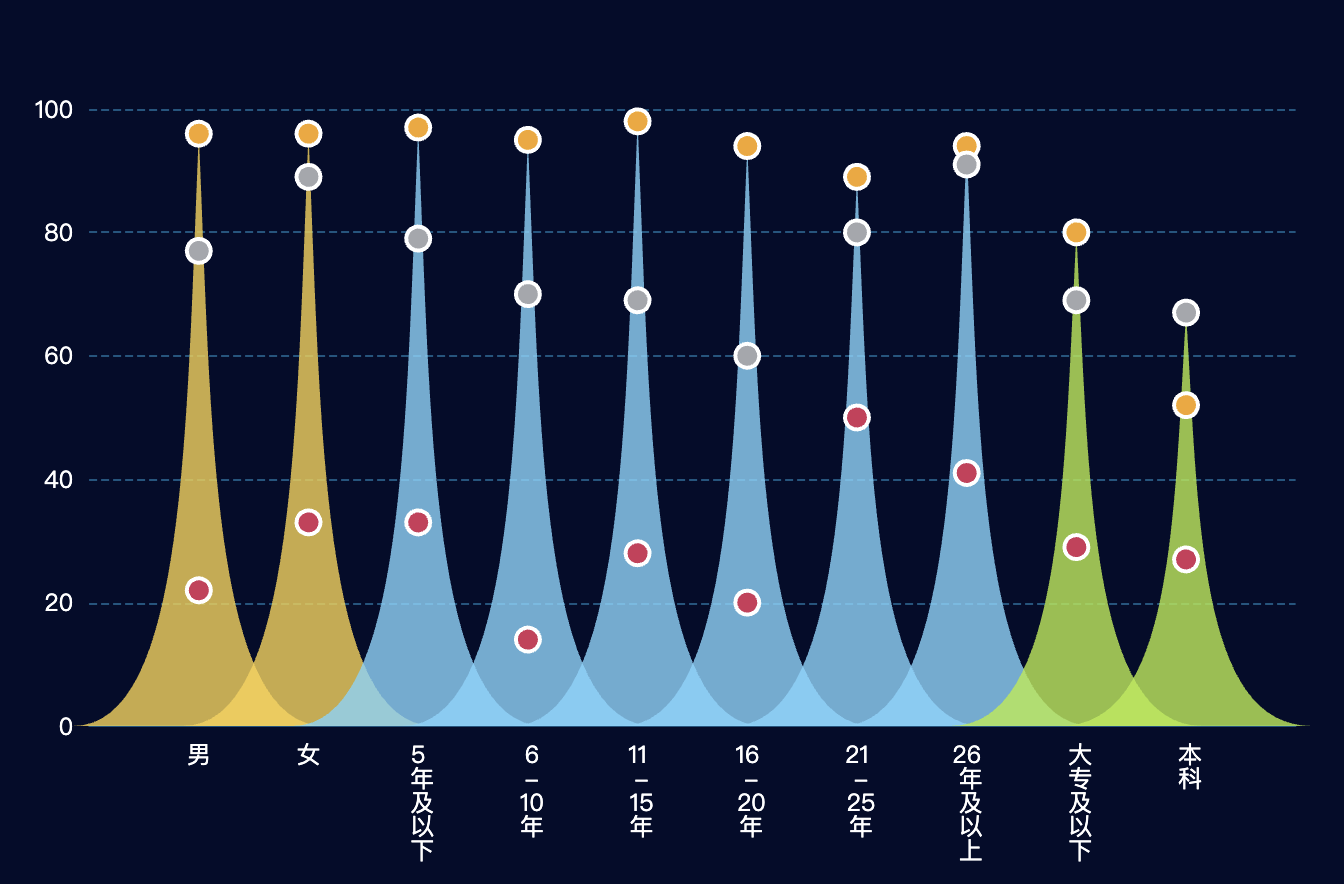
var aCategorys = ['', '男', '女', '5\n\r年\n\r及\n\r以\n\r下', ' 6\n\r-\n\r10\n\r年', '11\n\r-\n\r15\n\r年', '16\n\r-\n\r20\n\r年', '21\n\r-\n\r25\n\r年', '26\n\r年\n\r及\n\r以\n\r上',' 大\n\r专\n\r及\n\r以\n\r下',' 本\n\r科', ''];
var topdata = [0,96, 96, 97, 95, 98, 94, 89, 94, 80, 67, 90, 94,90,89];
var aSeries = [{
name: '岗位倾向',
type: 'line',
symbol:'circle',
symbolSize:12,
itemStyle: {
normal: {
color: '#F6A623',
borderColor:"#ffffff",
borderWidth:2
}
},
lineStyle: {
normal: {
opacity: 0
}
},
data: ['-',96, 96, 97, 95, 98, 94, 89, 94, 80, 52,'-']
}, {
name: '忠诚度',
type: 'line',
symbol:'circle',
symbolSize:12,
lineStyle: {
normal: {
opacity: 0
}
},
itemStyle: {
normal: {
color: '#A5A7AD',
borderColor:"#ffffff",
borderWidth:2
}
},
data: ['-',77, 89, 79, 70, 69, 60, 80, 91, 69, 67,'-']
}, {
name: '离职率',
type: 'line',
symbol:'circle',
symbolSize:12,
lineStyle: {
normal: {
opacity: 0
}
},
itemStyle: {
normal: {
color: '#d03559',
borderColor:"#ffffff",
borderWidth:2
}
},
data: ['-',22, 33, 33, 14, 28, 20, 50, 41, 29, 27,'-']
}];
aCategorys.forEach(function(v, i, a) {
var name = v;
if (v !== '') {
var data = [];
for (var j = 0; j < aCategorys.length; j++) {
data.push('-');
}
data[i - 1] = 0;
data[i] = topdata[i];
data[i + 1] = 0;
aSeries.push({
name: name,
type: 'pictorialBar',
smooth: false,
legendHoverLink:false,
symbol: 'path://M0,10 L10,10 C5.5,10 5.5,5 5,0 C4.5,5 4.5,10 0,10 z',
barCategoryGap: '-130%',
label:{
normal:{
show:false
},
emphasis:{
show:false
}
},
areaStyle: {
normal: {
color: {
type: 'linear',
x: 0,
y: 0,
x2: 0,
y2: 1,
colorStops: [{
offset: 0,
color: colors[i - 1] // 0% 处的颜色
}, {
offset: 1,
color: colors[i - 1] // 100% 处的颜色
}],
globalCoord: false // 缺省为 false
}
}
},
data: data,
});
}
});
var option = null;
option = {
backgroundColor: '#030c2b',
color: colors,
tooltip: {
trigger: 'axis',
formatter: function(params) {
console.log(params)
var rValue =params[0].name+'
';
params.forEach(function(v, i, a) {
if (v.data !== 0 && v.data !== "-" && v.seriesType == "line") {
rValue+=''+v.seriesName + ':' + v.data +'
';
}
})
return rValue;
}
},
legend: {
icon: 'circle',
itemWidth: 14,
itemHeight: 14,
itemGap: 15,
data: ['职业行为倾向', '角色价值观', '职业归属感'],
right: '4%',
textStyle: {
fontSize: 14,
color: '#424242'
}
},
xAxis: [{
type: 'category',
boundaryGap: false,
data: aCategorys,
axisTick: {
show:false,
alignWithLabel: true
},
axisLine: {
lineStyle: {
color: '#0f5681'
}
},
splitLine: {
show: false,
lineStyle: {
color: '#0f5681',
type: 'dotted'
},
},
axisLabel: {
show: true,
textStyle: {
color: '#fff', //更改坐标轴文字颜色
fontSize: 12 //更改坐标轴文字大小
}
}
}],
grid: {
left: '3%',
right: '4%',
bottom: '3%',
containLabel: true
},
yAxis: [{
type: 'value',
axisLine: {
lineStyle: {
color: '#0f5681'
}
},
axisTick: {
show:false,
alignWithLabel: true
},
splitLine: {
lineStyle: {
color: '#0f5681',
type: 'dashed' // solid dashed dotted
},
},
axisLabel: {
show: true,
align:'right',
textStyle: {
color: '#fff', //更改坐标轴文字颜色
fontSize: 12 //更改坐标轴文字大小
}
}
}],
series: aSeries
};
点击运行 》