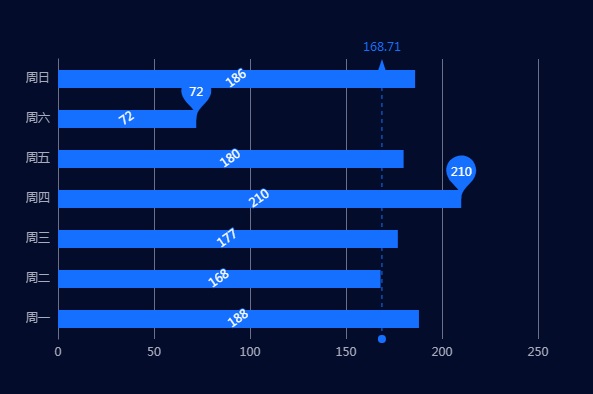
var option = {
  backgroundColor: '#030c2b',
  color: ["#156fff"],
   xAxis:{
    type:'value',
    axisTick:  {
      show: false
    },
    axisLabel: {
      textStyle: {
        color: '#a8abbb',
        fontSize: 12
      }
    },
    axisLine:  {
      show: false
    },
    splitLine: {
      lineStyle: {
        color: '#6c7087'
      }
    }
  },
  yAxis:{
    type:'category',
    data: ['周一','周二','周三','周四','周五','周六','周日'],
    splitLine: {
      show: false
    },
    axisTick: {
      show: false
    },
    axisLabel: {
      textStyle: {
        color: '#a8abbb',
        fontSize: 12
      }
    },
    axisLine: {
      lineStyle: {
        color: '#6c7087'
      }
    }
  },
  series:[
    {
    name:'访问量',
    type:'bar',
    markPoint:{ //标记点:标记出最大值和最小值
      data:[
        {
          type:'max',
          name:'最大值'
        },
        {
          type:'min',
          name:'最小值'
        }
      ]
    },
    markLine:{ //标记线:平均线
      data:[
        {
          type:'average',
          name: '平均值'
        }
      ]
    },
    label:{
      show:true, //每条柱子的数值显示
      rotate: 35 ,//数值旋转60度显示
      position: 'inside', //数值显示在柱子的哪个位置,top为柱子的顶部,inside为柱子内部
    },
    barWidth:'45%', //调节柱子的宽度
    data: [188,168,177,210,180,72,186]
    }
  ]
}
var myChart = echarts.init(document.getElementById('main'));
myChart.setOption(option);
点击运行 》

