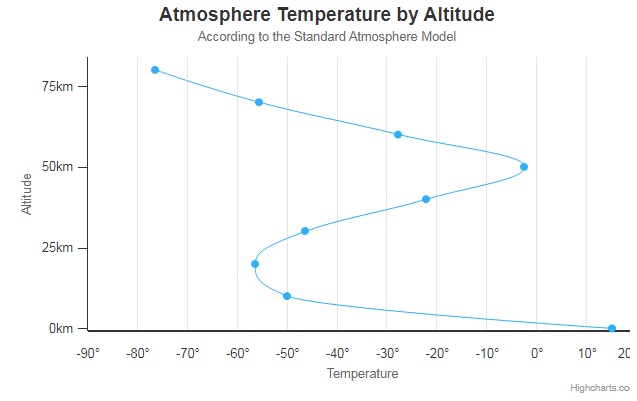
$(document).ready(function() {
   var chart = {
      type: 'spline',
      inverted: true
   };
   var title = {
      text: 'Atmosphere Temperature by Altitude'
   };
   var subtitle = {
      text: 'According to the Standard Atmosphere Model'
   };
   var xAxis = {
      reversed: false,
      title: {
         enabled: true,
         text: 'Altitude'
      },
      labels: {
         formatter: function () {
            return this.value + 'km';
         }
      },
      maxPadding: 0.05,
      showLastLabel: true
   };
   var yAxis = {
      title: {
         text: 'Temperature'
      },
      labels: {
         formatter: function () {
            return this.value + '\xB0';
         }
      },
      lineWidth: 2
   };
   var legend = {
      enabled: false
   };
   var tooltip = {
      headerFormat: '<b>{series.name}</b><br/>',
      pointFormat: '{point.x} km: {point.y}\xB0C'
   };
   var plotOptions = {
      spline: {
         marker: {
            enable: false
         }
      }
   };
   var series= [{
      name: 'Temperature',
      data: [[0, 15], [10, -50], [20, -56.5], [30, -46.5], [40, -22.1],
            [50, -2.5], [60, -27.7], [70, -55.7], [80, -76.5]]
   }];


   var json = {};
   json.chart = chart;
   json.title = title;
   json.subtitle = subtitle;
   json.legend = legend;
   json.tooltip = tooltip;
   json.xAxis = xAxis;
   json.yAxis = yAxis;
   json.series = series;
   json.plotOptions = plotOptions;
   $('#container').highcharts(json);

});
点击运行 》

