$(document).ready(function() {
   var title = {
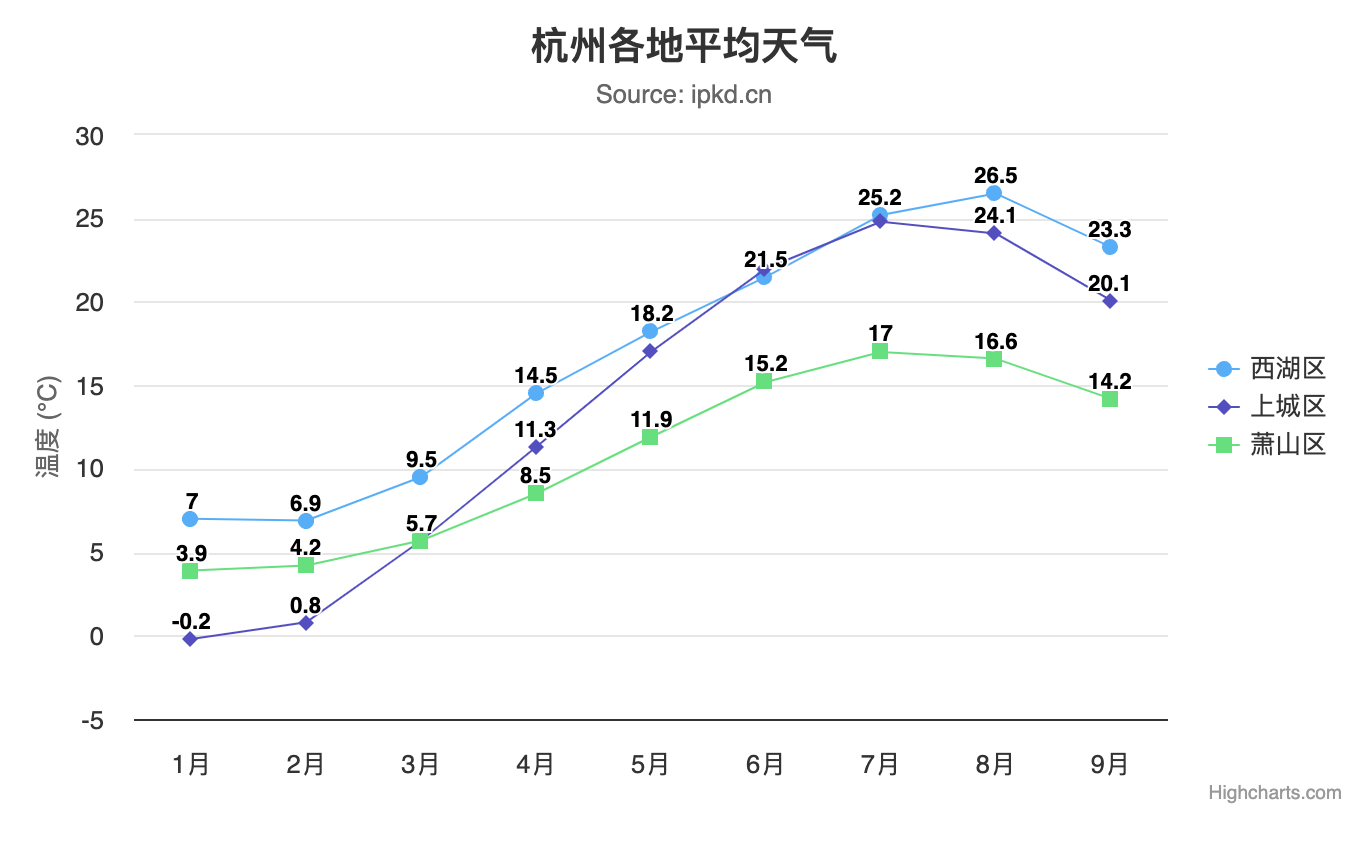
	  text: '杭州各地平均天气'
   };
   var subtitle = {
	  text: 'Source: ipkd.cn'
   };
   var xAxis = {
	  categories: ['1月', '2月', '3月', '4月', '5月', '6月', '7月', '8月', '9月']
   };
   var yAxis = {
	  title: {
		 text: '温度 (\xB0C)'
	  },
	  plotLines: [{
		 value: 0,
		 width: 1,
		 color: '#808080'
	  }]
   };

   var tooltip = {
	  valueSuffix: '\xB0C'
   }

   var legend = {
	  layout: 'vertical',
	  align: 'right',
	  verticalAlign: 'middle',
	  borderWidth: 0
   };

   var plotOptions = {
	  line: {
		 dataLabels: {
			enabled: true
		 },
		 enableMouseTracking: false
	  }
   };

   var series =  [
	  {
		 name: '西湖区',
		 data: [7.0, 6.9, 9.5, 14.5, 18.2, 21.5, 25.2,
			26.5, 23.3]
	  },
	  {
		 name: '上城区',
		 data: [-0.2, 0.8, 5.7, 11.3, 17.0, 22.0, 24.8,
			24.1, 20.1]
	  },
	  {
		 name: '萧山区',
		 data: [3.9, 4.2, 5.7, 8.5, 11.9, 15.2, 17.0,
			16.6, 14.2]
	  }
   ];

   var json = {};

   json.title = title;
   json.subtitle = subtitle;
   json.xAxis = xAxis;
   json.yAxis = yAxis;
   json.tooltip = tooltip;
   json.legend = legend;
   json.series = series;
   json.plotOptions = plotOptions;
   $('#myChart').highcharts(json);
});
点击运行 》

