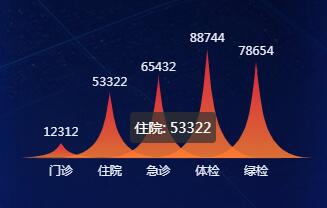
下面介绍一个百度echarts不一样的柱状图——曲顶柱状图
var charts = echarts.init(document.getElementById('charts'));
pictorialBarOption = {
	title: {
		text: '曲顶柱状图',
		textStyle: {
			color: '#fff',
			fontSize: 17,
			fontWeight: 100
		}
	},
	grid: {
		top: '23%',
		bottom: '20%',
		containLabel: true
	},
	tooltip: {
		trigger: 'axis',
		axisPointer: {
			type: 'none'
		},
		formatter: function(params) {
			return params[0].name + ': ' + params[0].value;
		}
	},
	xAxis: {
		data: ["门诊", "住院", "急诊", "体检", "绿检"],
		axisTick: {
			show: false
		},
		axisLine: {
			lineStyle: {
				color: 'rgba(255, 129, 109,.1)',
				width: 1 //这里是为了突出显示加上的
			}
		},
		axisLabel: {
			textStyle: {
				color: '#eaedfc',
				fontSize: 12
			}
		}
	},
	yAxis: {
		splitLine: {
			show: false
		},
		axisTick: {
			show: false
		},
		axisLine: {
			show: false
		},
		axisLabel: {
			show: false
		}
	},
	color: ['#e54035'],
	series: [{
		name: 'hill',
		type: 'pictorialBar',
		barCategoryGap: '-130%',
		symbol: 'path://M0,10 L10,10 C5.5,10 5.5,5 5,0 C4.5,5 4.5,10 0,10 z',
		label: {
			show: true,
			position: 'top',
			distance: 4,
			color: '#eaedfc',
			// fontWeight: 'bolder',
			fontSize: 12
		},
		itemStyle: {
			normal: {
				color: {
					type: 'linear',
					x: 0,
					y: 0,
					x2: 0,
					y2: 1,
					colorStops: [{
							offset: 0,
							color: 'rgba(254, 42, 62,0.85)'
						},
						{
							offset: 1,
							color: 'rgba(255, 126, 49,0.85)'
						}
					],
					global: false
				}
			},
			emphasis: {
				opacity: 1
			}
		},
		data: [12312,53322,65432,88744,78654],
		z: 10
	}]
};
charts.setOption(pictorialBarOption);
window.addEventListener("resize", function () {
	charts.resize();
})